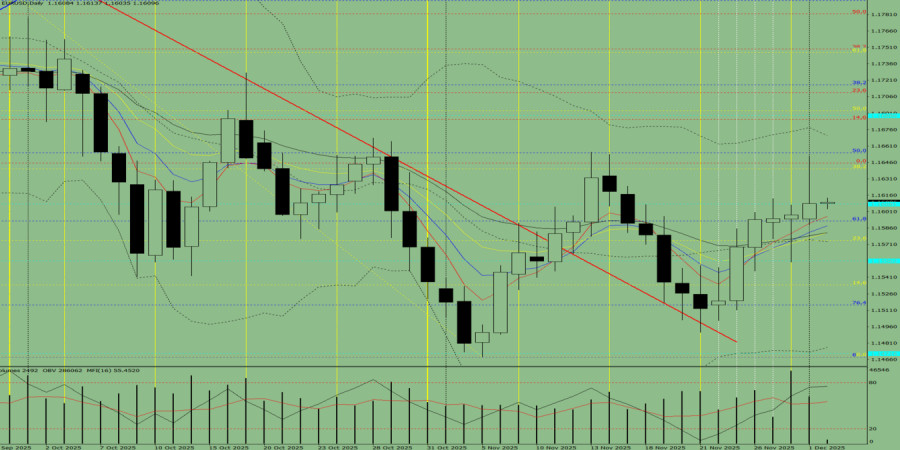
Trend Analysis (Fig. 1)
On Tuesday, from the level of 1.1608 (yesterday's daily candle close), the market may continue moving downward toward the target of 1.1575 — the 23.6% retracement level (yellow dashed line). When testing this level, the price may possibly rebound upward with the target of testing the 61.8% retracement level at 1.1592 (blue dashed line).
Fig. 1 (daily chart)
Comprehensive Analysis:
Overall conclusion: a downward trend.
Alternative scenario:From the level of 1.1608 (yesterday's daily candle close), the price may continue moving downward toward the target of 1.1556 — a historical support level (light-blue dashed line). Upon testing this level, the price may possibly rebound upward toward 1.1575 — the 23.6% retracement level (yellow dashed line).

QUICK LINKS
ForexMart is authorized and regulated in various jurisdictions.
(Reg No.23071, IBC 2015) with a registered office at First Floor, SVG Teachers Co-operative Credit Union Limited Uptown Building, Corner of James and Middle Street, Kingstown, Saint Vincent and the Grenadines
Restricted Regions: the United States of America, North Korea, Sudan, Syria and some other regions.


 Contact Us

