Ceny ropy v pátek vzrostly o více než 1 % a směřují k týdennímu růstu, protože obchodní napětí mezi hlavními spotřebiteli ropy – Čínou a USA – vykazuje známky zmírnění a Británie oznámila vlastní obchodní dohodu s USA.
Cena ropy Brent vzrostla o 1,19 USD, tedy přibližně o 1,9 %, na 64,03 USD za barel. Americká WTI vzrostla o 1,21 USD, přibližně o 2 %, na 61,12 USD za barel. Oba kontrakty směřují k více než 4% týdennímu zisku.
Naděje na zmírnění obchodní války mezi USA a Čínou pomohly ve čtvrtek ropě Brent k 3% růstu, uvedl analytik PVM John Evans.
Americký ministr financí Scott Bessent se má 10. května setkat ve Švýcarsku s čínským vicepremiérem He Lifengem, aby se pokusili vyřešit obchodní spory, které ohrožují poptávku po ropě.
„Pokud si obě strany dohodnou datum formálních jednání a souhlasí se snižováním cel během rozhovorů, trhy se mohou uklidnit a cena ropy by mohla vzrůst o další 2–3 USD za barel,“ uvedla Vandana Hari, zakladatelka analytické společnosti Vanda Insights.
Mezitím čínský vývoz v dubnu rostl rychleji, než se očekávalo, a dovoz klesal pomaleji, což Pekingu poskytlo určitou úlevu před tarifními jednáními.
Dovoz ropy do Číny v dubnu meziměsíčně klesl, ale meziročně vzrostl o 7,5 %, což bylo podpořeno hromaděním zásob během odstávek státních rafinerií.
On Tuesday, the EUR/USD pair continued drifting lower slowly and with low volatility. The euro has now declined for three straight days, despite having no fundamental or technical justification. We continue to view nearly any current growth in the U.S. dollar as illogical. Traders should keep in mind the clearly visible range-bound structure on the daily timeframe, which may be the main reason behind the unusual and erratic price movements.
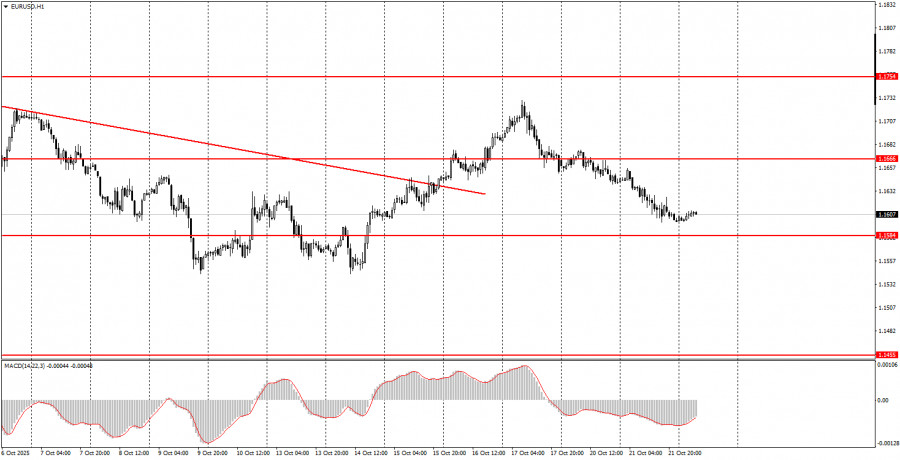
On both Monday and Tuesday, there were no noteworthy economic reports or events in either the Eurozone or the United States. As a result, traders had little to react to. The upward trend on the hourly chart remains in force after the recent breakout above another descending trendline. However, the pair continues falling despite the absence of a clear reason.
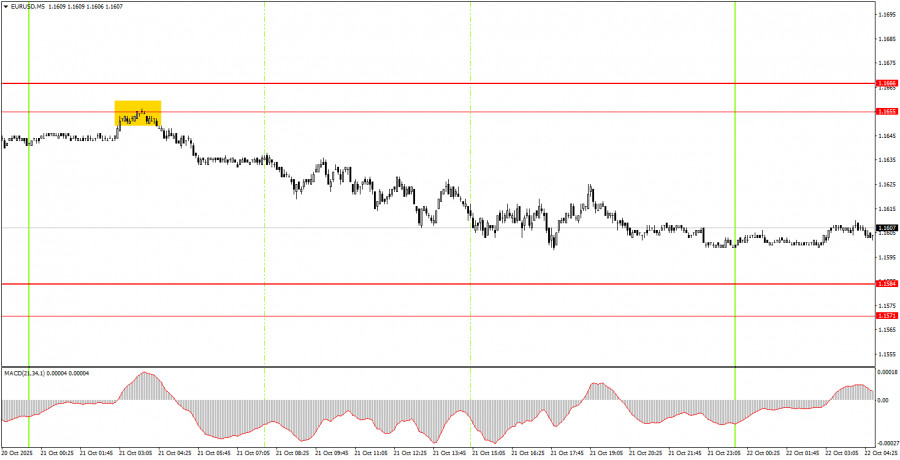
On the 5-minute timeframe, only one valid trading signal was generated throughout Tuesday, and it formed during the Asian session. The price perfectly bounced off the 1.1655 level, then proceeded to decline by 40 pips. Those traders who managed to act on this signal may have booked solid short-term gains, especially considering the limited daily volatility.
On the hourly chart, EUR/USD is starting to exhibit signs of a resumed upward trend. The descending trendline has once again been broken, and the overall fundamental and macroeconomic backdrop remains unfavorable for the U.S. dollar. Therefore, we continue to anticipate further development of the 2025 bullish trend. However, traders should keep in mind that the broad sideways range on the daily timeframe continues to dictate price behavior. It is this very flat structure that leads to low volatility and irrational movements on lower timeframes.
On Wednesday, EUR/USD may move in any direction, once again due to the absence of fundamentals. The next trading signals are likely to emerge near the 1.1571–1.1584 area, where the price was located at the time of writing.
For intraday trading on the 5-minute chart, the following levels should be monitored: 1.1354–1.1363, 1.1413, 1.1455–1.1474, 1.1527, 1.1571–1.1584, 1.1655–1.1666, 1.1745–1.1754, 1.1808, 1.1851, 1.1908, 1.1970–1.1988. On Wednesday, European Central Bank President Christine Lagarde is scheduled to give another public speech, but market interest remains very low. Meanwhile, the U.S. economic calendar is empty.
Important Note for Beginners
Trading during major news events (as listed on the calendar) can significantly impact price movement. During such times, trade cautiously or step out of the market entirely to avoid a sharp reversal against your position.
Beginners must remember that not every trade can be profitable. The key to long-term success in forex is maintaining a consistent strategy, reinforcing discipline, controlling risk, and following sound money management principles.

RYCHLÉ ODKAZY
ForexMart is authorized and regulated in various jurisdictions.
(Reg No.23071, IBC 2015) with a registered office at First Floor, SVG Teachers Co-operative Credit Union Limited Uptown Building, Corner of James and Middle Street, Kingstown, Saint Vincent and the Grenadines
Restricted Regions: the United States of America, North Korea, Sudan, Syria and some other regions.


 Kontaktujte nás

