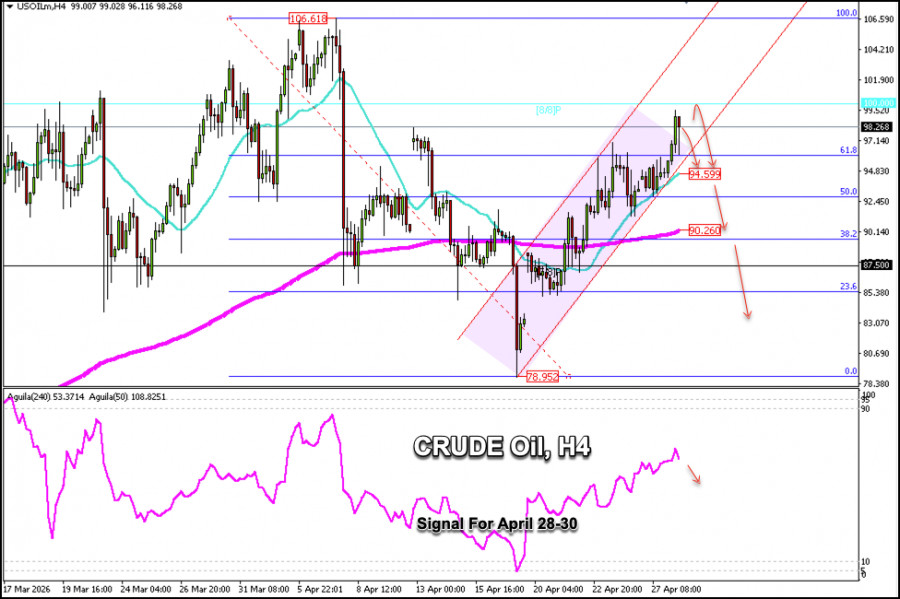
Nachdem sich der Kurs seit Wochenbeginn über 93 USD in der Nähe des 50%-Fibonacci-Levels gefestigt hat, gewinnt USD/OIL nun deutlich an Aufwärtsdynamik und erreichte in den frühen Stunden der europäischen Sitzung den Bereich um 99,48 USD pro Barrel.
Im technischen Chart ist nach dem Anstieg unterhalb von 100 USD eine Korrektur in Richtung 96,50 USD zu erkennen, nahe dem 61,8%-Fibonacci-Level. Wir sehen zwar auch einen technischen Rebound, aber Rohöl dürfte bereits Schwierigkeiten haben, den Aufwärtstrend fortzusetzen, weshalb Verkäufe sinnvoll erscheinen.
Sollte Rohöl den starken Widerstand bei 100 USD an der 8/8-Murray-Linie erreichen und in den nächsten Stunden deutlich abgewiesen werden, könnte dies als Signal zum Eröffnen von Short-Positionen gewertet werden – mit Kurszielen am 61,8%-Fibonacci-Level bei etwa 96,50 USD und an der 21-SMA bei rund 94,59 USD.
Im H4-Chart ist die Fibonacci-Retracement-Linie zu sehen, die Rohöl während der asiatischen Sitzung am 61,8%-Level auf dem Weg in Richtung 100 USD überschritten hat. Konsolidiert der Kurs unterhalb des 61,8%-Fibonacci-Levels, könnte dies als klares Verkaufssignal für die kommenden Tage interpretiert werden.
Der Eagle-Indikator liefert ein negatives Signal, sodass um 99,50 USD oder darunter verkauft werden kann, mit Kurszielen bei 96 USD und schließlich an der 21-SMA.
Rohöl hat am 17. April ein Gap hinterlassen, das geschlossen werden könnte, falls der Kurs unter 95 USD fällt und den Aufwärtstrendkanal deutlich nach unten verlässt. In diesem Fall wäre ein Rückgang zur 200-Tage-EMA im Bereich von 90 USD und in der Folge bis auf 83 USD möglich.

QUICK LINKS
ForexMart is authorized and regulated in various jurisdictions.
(Reg No.23071, IBC 2015) with a registered office at First Floor, SVG Teachers Co-operative Credit Union Limited Uptown Building, Corner of James and Middle Street, Kingstown, Saint Vincent and the Grenadines
Restricted Regions: the United States of America, North Korea, Sudan, Syria and some other regions.


 Kontakt mit uns aufnehmen

