Trading Signals for GOLD (XAU/USD) for April 19-22, 2024: sell below $2,395 (+2/8 Murray - overbought) | Market Analysis
 

Analytical Reviews

Forexmart's analytical reviews provide up-to-date technical information about the financial market. These reports range from stock trends, to financial forecasts, to global economy reports, and political news that impact the market.

Disclaimer:  Information provided here to retail and professional clients does not contain and should not be construed as containing investment advice or an investment recommendation or an offer or solicitation to engage in any transaction or strategy in financial instruments. Past performance is not a guarantee or prediction of future performance.

Trading Signals for GOLD (XAU/USD) for April 19-22, 2024: sell below $2,395 (+2/8 Murray - overbought)
10:58 2024-04-19 UTC--4

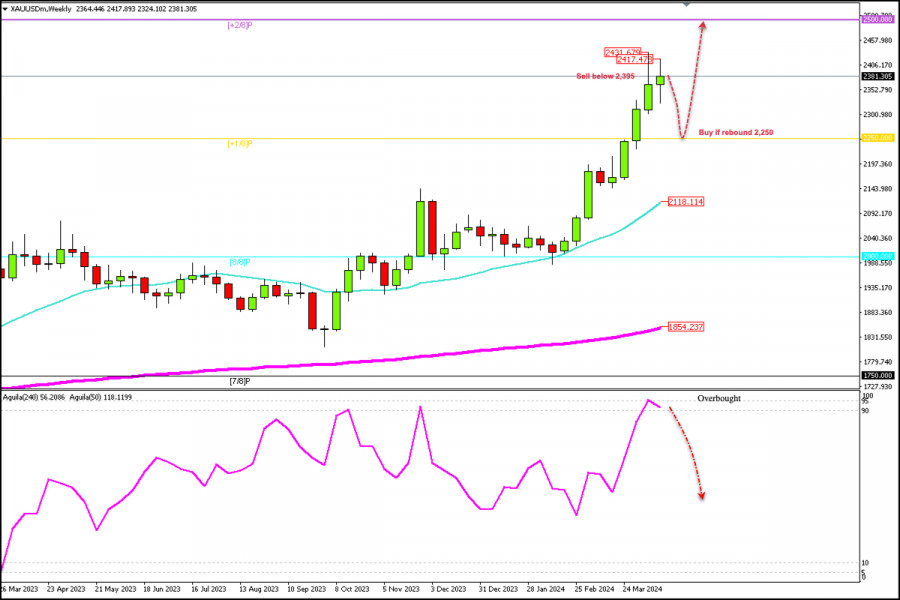
The weekly chart shows that gold maintains bullish momentum and has had strong gains for 10 consecutive weeks, but technically we are seeing an exhaustion of strength and it is likely that gold could fall in the coming days.

Gold has formed a Japanese candlestick pattern that left a long wick and a small body which means that there are resistance levels that prevent gold from a further rise. So, a trend reversal could occur.

Gold is showing signs of exhaustion and the outlook could be negative for the next few days if it trades below the psychological level of 2,400.

On the weekly chart, we see a consolidation for two weeks around the 2,400 area. Having reached the high of 2,431, we can observe a technical correction and now gold has reached another one-week high at 2,417. Since then, the metal has been showing another consolidation. It means that we could be facing the possibility of a trend change in the next weeks.

If gold consolidates above 2,400 in the coming days, then the bullish cycle could resume and the instrument could continue with its bullish potential and reach +2/8 Murray located at 2,500.

Technically, there is a strong bullish trend in gold, but a significant technical correction should occur on the weekly chart since we have observed bullish closes for several weeks. It indicates a negative week outlook for the next few days, so we could expect the price to fall towards 2,250. At that point, the price could make a technical rebound.

コメントする

ForexMart is authorized and regulated in various jurisdictions.

(Reg No.23071, IBC 2015) with a registered office at Shamrock Lodge, Murray Road, Kingstown, Saint Vincent and the Grenadines

Restricted Regions: the United States of America, North Korea, Sudan, Syria and some other regions.


© 2015-2024 Tradomart SV Ltd.
Top Top
Risk Warning:
Foreign exchange is highly speculative and complex in nature, and may not be suitable for all investors. Forex trading may result in a substantial gain or loss. Therefore, it is not advisable to invest money you cannot afford to lose. Before using the services offered by ForexMart, please acknowledge the risks associated with forex trading. Seek independent financial advice if necessary. Please note that neither past performance nor forecasts are reliable indicators of future results.