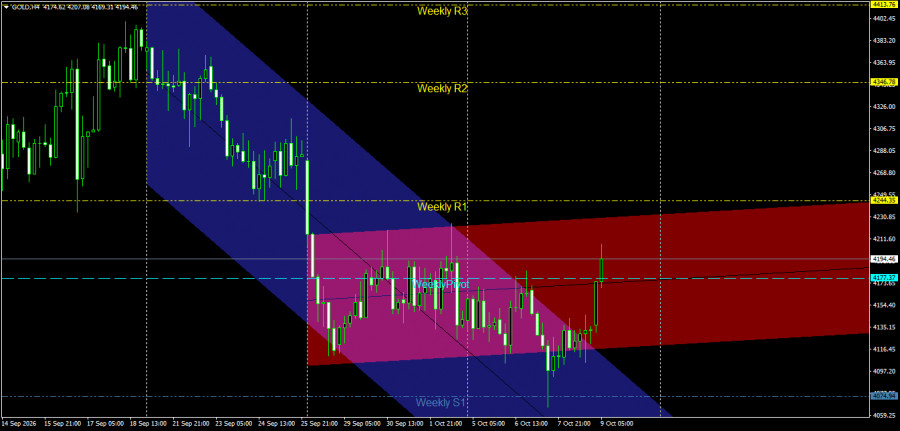
The 4-hour (H4) chart for Gold (GOLD) shows a notable bullish surge in recent hours; the price is currently trading at the 4194.46 level after rebounding from an intraday low and reclaiming territory above the weekly pivot point.
Technical Analysis and Price Action
Price Channel Structure: The price successfully broke above the upper boundary of the primary bearish channel (blue) and surged into the corrective sub-channel (pink/red). This breakout followed a strong bullish rebound from levels near the first weekly support (Weekly S1) at 4074.94, where the price formed a higher local low, allowing buyers to re-enter the market forcefully.
Interaction with Pivot Levels: Gold managed to break above the weekly pivot point at 4177.37 and hold above it, confirmed by a bullish 4-hour candle. This surge paves the way for further gains and a test of subsequent resistance levels, with the weekly pivot shifting from a resistance level to a key support level underpinning the intraday bullish trend.
Key Support and Resistance Levels
Key Resistance Levels:
Resistance 1: 4211.60 – 4230.85 (Previous intraday peak zones and the trading range within the pink channel).
Resistance 2: 4244.35 (Weekly R1 resistance level). Key Resistance: Level 4346.78 (Weekly Resistance 2 - Weekly R2).
Key Support Levels:
Support 1: Level 4177.37 (Weekly Pivot Point).
Support 2: Levels 4135.15 – 4154.40 (Lower bound of the near-term fluctuation range).
Key Support: Level 4074.94 (Weekly Support 1 - Weekly S1).
Price Action Outlook and Trading Recommendations
Bullish Scenario (Primary):
A positive trajectory is the most likely outcome in the near term, provided the price maintains trading above the Weekly Pivot level of 4177.37.
Recommendation: Buy while holding above 4177.37, or upon a successful retest of this level.
Technical Targets: Target the 4211.60 area first, then extend toward the Weekly Resistance 1 level at 4244.35.
Stop Loss: A 4-hour candle close below the 4154.40 level.
Bearish Scenario (Alternative):
This scenario is triggered if the price returns to trade below the Weekly Pivot point of 4177.37 and closes beneath it.
Confirmation Condition: Breaking below 4177.37 and returning inside the blue bearish channel.
Technical Targets: Retesting support areas at 4135.15, followed by a move toward 4116.45.
The daily timeframe chart for Gold (GOLD) shows price action trading within a bearish corrective channel following a strong pullback from the peak recorded near the second monthly resistance level (Monthly R2) at 4659.09. The price is currently trading around the 4195.90 level, attempting to build a positive rebound wave from the lower boundary of the bearish channel.
Technical Analysis and Price Action
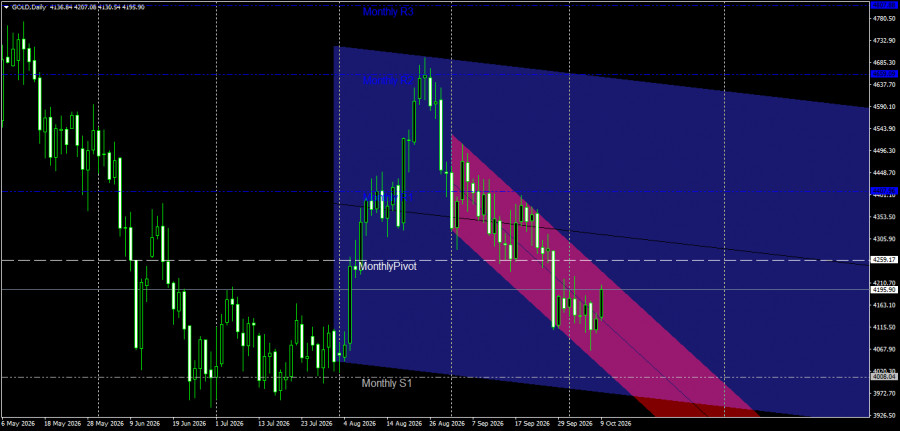
Price Channel Structure: The price is trading within a primary bearish channel with a wide angle (blue) and a steeper sub-channel (pink/red). Gold recently managed to rebound upward from the intraday low recorded near the first monthly support level (Monthly S1) at 4008.04, retesting the mid-levels of the pink channel.
Interaction with Monthly Pivot Levels: The price slid sharply toward lower levels after breaking below the Monthly Pivot point at 4259.17 and the first monthly resistance level (Monthly R1) at 4407.96. The price currently remains below the Monthly Pivot line at 4259.17, rendering the current rise merely an upward corrective move until proven otherwise.
Key Support and Resistance Levels
Key Resistance Levels:
Resistance 1: 4210.70 – 4259.17 (Monthly Pivot level and the upper boundary of the sub-channel). Second Resistance: 4407.96 (Monthly R1).
Pivot Resistance: 4659.09 (Monthly R2).
Key Support Levels:
First Support: 4115.50 – 4163.10 (nearby intraday low zones).
Second Support: 4008.04 (Monthly S1).
Key Support: 3926.50 (lower boundary of the main bearish channel).
Price Action Outlook and Trading Recommendations
Bearish Scenario (Primary):
The overall trend remains bearish on the daily timeframe as long as the price holds below the monthly pivot level of 4259.17 and within the bearish range.
Recommendation: Sell upon a retest of the resistance zone between 4210.70 and 4259.17, provided the resistance holds.
Technical Targets: Retargeting the 4115.50 zone as the first target, extending toward Monthly S1 at 4008.04.
Stop Loss: A daily close above 4259.17.
Bullish Corrective Scenario (Alternative):
Triggered if the price successfully breaks above the monthly pivot point of 4259.17 and closes the day above it.
Confirmation Condition: Breaking 4259.17 and holding above it.
Technical Targets: Opening the way for an extended bullish correction toward 4353.50, followed by the 4407.96 level. Risk Management
Trading on the daily timeframe requires adherence to capital management rules and limiting risk to no more than 1% to 2% per trade, while monitoring daily closes to confirm the trend.
ForexMart is authorized and regulated in various jurisdictions.
(Reg No.23071, IBC 2015) with a registered office at First Floor, SVG Teachers Co-operative Credit Union Limited Uptown Building, Corner of James and Middle Street, Kingstown, Saint Vincent and the Grenadines
Restricted Regions: the United States of America, North Korea, Sudan, Syria and some other regions.












 コンタクトする