Společnost Nvidia (NASDAQ:NVDA) plánuje v Číně představit novou čipovou sadu pro umělou inteligenci, která bude výrazně levnější než nedávno omezený model H20, informovala v pondělí agentura Reuters.
Společnost hodlá zahájit masovou výrobu nového čipsetu již v červnu, dodala zpráva s odvoláním na zdroje obeznámené s touto záležitostí.
Grafický procesor (GPU) bude součástí nejnovější generace procesorů Nvidia s architekturou Blackwell pro umělou inteligenci.
Očekávané cenové rozpětí této nové čipové sady se pohybuje mezi 6 500 a 8 000 USD, což je podstatně méně než cena modelu H20, která činí 10 000 až 12 000 USD, dodala agentura Reuters.
Snížená cena nové čipové sady je přisuzována jejím méně výkonným specifikacím a jednodušším výrobním požadavkům.

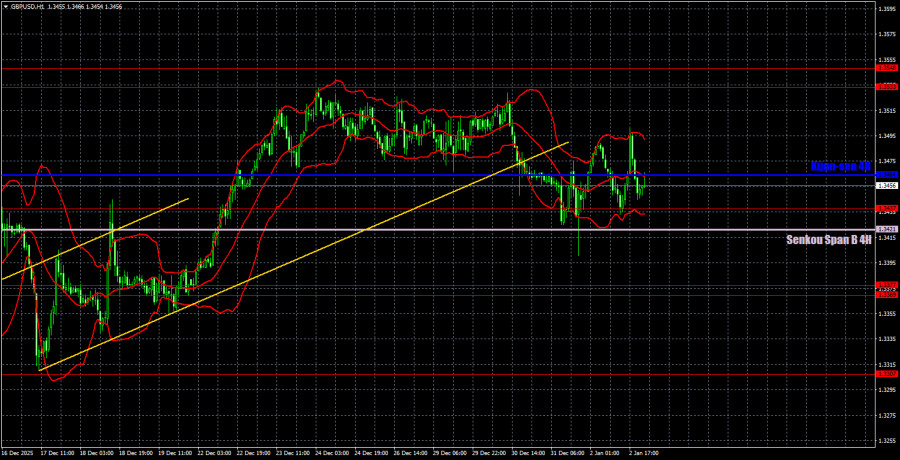
The GBP/USD currency pair on Friday attempted to continue the downward move, but it could not close below the important Senkou Span B line. Thus, for the pound, despite the breach of the trendline, the trend remains up. The holidays are over, traders are returning to the market after a two-week break, and the event calendar is again filling with important data.
As we have already said, the current week may be relatively "stormy." The storm may begin already today due to Donald Trump's military operation in Venezuela, since an event of this scale is unlikely to go unnoticed by the markets. We note that the conflict between the US and Venezuela may not be limited to Maduro's arrest. Therefore, we are sure to see many more interesting developments around this event. In addition, important macroeconomic data will be published in the US this week, which will also affect GBP/USD. However, abstracting from all these events, above the Senkou Span B line, the pound sterling still has a good chance of continuing to rise against the US dollar.
On the 5-minute timeframe on Friday, the pair repeatedly changed direction, so many signals were formed. However, in the area of their formation, there were immediately two Ichimoku lines and the 1.3437 level. Thus, one could realistically trade only a rebound from 1.3437 (due to its high precision) or a close above the critical Kijun-sen line (since there is room to the upside).
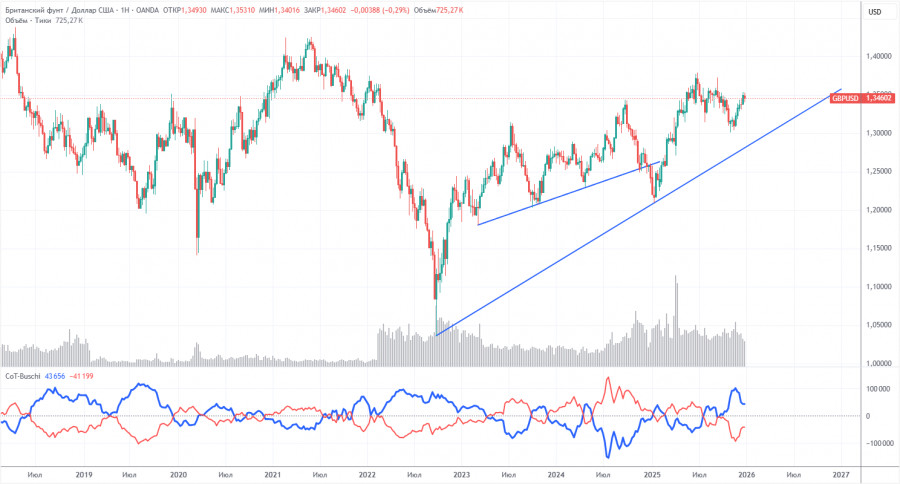
COT reports for the pound show that, in recent years, commercial traders' sentiment has been changing frequently. The red and blue lines representing the net positions of commercial and non-commercial traders constantly cross and, in most cases, remain near zero. At present, the lines are diverging, but the dominant players are now non-commercial traders with short positions. Speculators increasingly sell the pound, but, as we have already said, it does not matter how low the demand for the British currency is. For the US dollar, it is often even lower.
The dollar continues to decline due to Donald Trump's policies, as shown on the weekly timeframe (illustration above). The trade war will continue in one form or another for a long time, and the Federal Reserve will, in any case, lower rates within the next 12 months. Demand for the dollar will fall one way or another. According to the latest COT report (dated December 23) for the British pound, the Non-commercial group opened 1,600 BUY contracts and closed 5,700 SELL contracts. Thus, the net position of non-commercial traders increased by 7,300 contracts over the week.
In 2025, the pound rose quite strongly, but one should understand that the reason is one: Trump's policy. As soon as this reason is neutralized, the dollar may begin to rise, but nobody knows when.
On the hourly timeframe, the GBP/USD pair continues to form an upward trend despite the trendline breach. The pound's rise in the medium term will continue regardless of the local macroeconomic and fundamental backdrop. The trend for the pound remains upward on almost all timeframes. It is important for the bulls not to lose the Senkou Span B line and not to fall below it.
For January 5, we highlight the following important levels: 1.2863, 1.2981–1.2987, 1.3042–1.3050, 1.3096–1.3115, 1.3201–1.3212, 1.3307, 1.3369–1.3377, 1.3437, 1.3533–1.3548, 1.3584. The Senkou Span B (1.3421) and Kijun-sen (1.3464) lines can also be sources of signals. It is recommended to move the stop loss to breakeven when the price moves 20 pips in the correct direction. Ichimoku indicator lines may shift during the day, which should be taken into account when determining trading signals.
On Monday, the UK calendar is empty, while the US will publish the important ISM manufacturing index. If this report is positive, the pair may attempt to close below the Senkou Span B and finally switch to a bearish stance. Otherwise, we will see a natural rise.
Today, traders can consider shorts if the price closes below the Senkou Span B line with a target of 1.3369–1.3377. Long positions will be relevant if the price closes above the critical line with a target of 1.3533–1.3548 or in case of pronounced rebounds from the 1.3437 level or the Senkou Span B line.
Price support and resistance levels (resistance/support) — thick red lines near which movement may end. They are not sources of trading signals.
Kijun-sen and Senkou Span B lines — Ichimoku indicator lines transferred to the hourly timeframe from the 4-hour. They are strong lines.
Extremum levels — thin red lines from which the price previously bounced. They are sources of trading signals.
Yellow lines — trend lines, trend channels and any other technical patterns.
Indicator 1 on the COT charts — the size of the net position of each trader category.
ForexMart is authorized and regulated in various jurisdictions.
(Reg No.23071, IBC 2015) with a registered office at First Floor, SVG Teachers Co-operative Credit Union Limited Uptown Building, Corner of James and Middle Street, Kingstown, Saint Vincent and the Grenadines
Restricted Regions: the United States of America, North Korea, Sudan, Syria and some other regions.


 コンタクトする

