Evropský index Stoxx Aerospace and Defense dnes ráno vzrostl na novou rekordní úroveň, a to po nárůstu o přibližně 1,1 %.
Od začátku roku tento index vzrostl o více než 53 %.
Mezi nejlepšími společnostmi v tomto sektoru se ve středu objevila německá Renk, jejíž akcie vzrostly o 5,3 % poté, co agentura Bloomberg informovala, že výrobce dílů pro vojenská vozidla zvažuje rozšíření své činnosti o civilní segment. Polská společnost Lubawa uzavřela obchodování s 3% ziskem, zatímco Airbus posílil o 1,2 %.
The GBP/USD currency pair displayed movements similar to those of the EUR/USD pair on Tuesday. A sharp rise began at the start of the American trading session, but the British pound once again failed to develop a positive trend. By evening, another decline in quotes began and continued overnight. Thus, the British currency is currently just correcting within a downward trend, which is more clearly visible on the 4-hour timeframe. There were no significant events in the UK yesterday, while the JOLTs report on job openings was released in the US. Despite the report's higher-than-forecasted value, the market ignored it. It's also unlikely to say that geopolitics triggered the market movements. The US dollar fell, which would typically indicate an improvement in the negotiation track in the Middle East. However, in reality, the US and Iran still cannot agree on even the next meeting for negotiations. The conflict remains in a suspended state, and Donald Trump is contemplating the resumption of war. The current rise of the British pound is purely technical.
From a technical perspective, the price is above the 1.3179-1.3187 range, which can be considered support for the British currency. Another drop below this area could send the pound into a new free fall. Above the critical line, there remain certain chances for an upward correction targeting the Senkou Span B line. A trend line can currently only be formed on the 4-hour timeframe, as the downward trend has persisted for two months. The only positive aspect for the pound is the upward trend on the weekly timeframe.
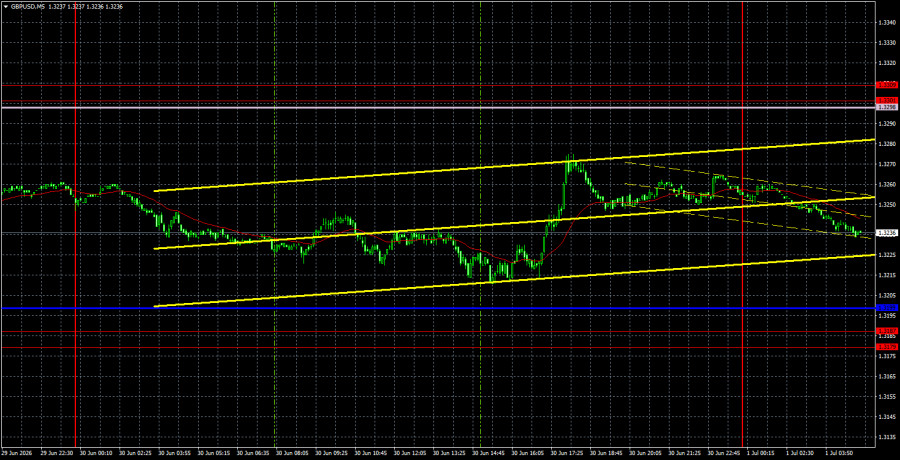
On the 5-minute timeframe on Tuesday, no trading signals were formed. The price failed to work out any lines or levels throughout the day. Thus, there were simply no grounds to open positions.
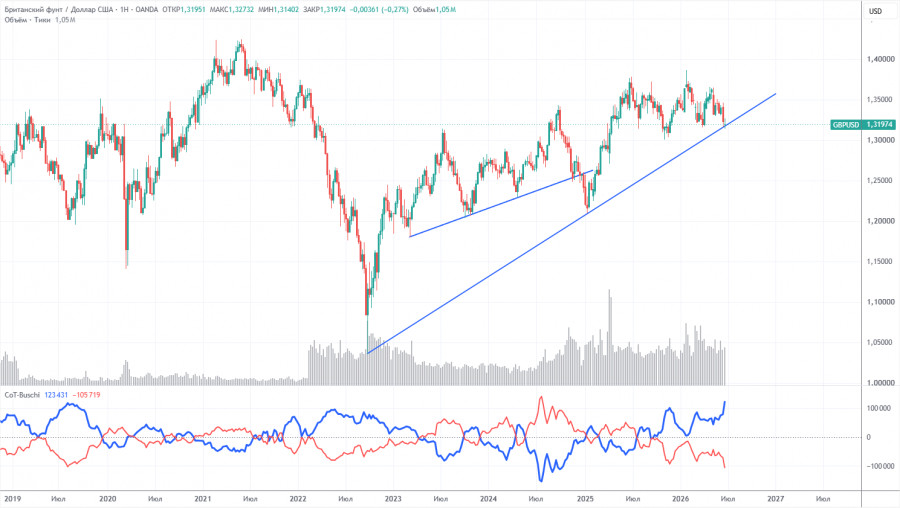
COT reports on the British pound indicate that sentiment among commercial traders has been constantly shifting over the past few years. The red and blue lines, which reflect the net positions of commercial and non-commercial traders, continually cross and are mostly close to the zero mark. Currently, the lines are distancing from each other, with non-commercial traders still dominating with... sales. Given the events in the Middle East, it is not surprising that demand for riskier currencies is low.
In the long term, the dollar continues to decline due to Donald Trump's policies, as clearly visible on the weekly timeframe (illustration above). The trade war will continue in some form for a long time, and Trump's policies are aimed, both directly and indirectly, at weakening the US currency. However, currently, geopolitical factors play a major role, providing strong support for the dollar in 2026. Since the conflict in the Middle East is not yet resolved, the US dollar may still show growth potential. According to the latest COT report (dated June 23), the "Non-commercial" group closed 1,300 BUY contracts and opened 32,900 SELL contracts. Consequently, the net position of non-commercial traders decreased by another 31,600 contracts over the week.
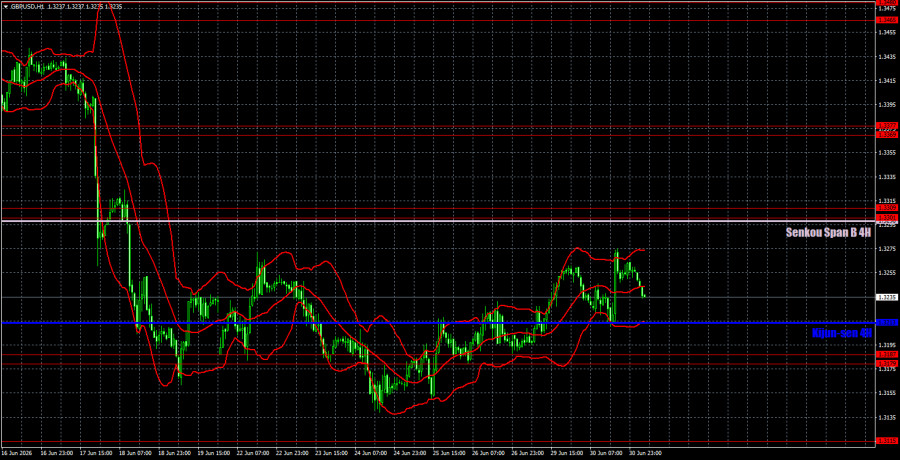
On the hourly timeframe, the GBP/USD pair continues its downward trend, which does not align with the local fundamental and geopolitical backdrop. Currently, a correction is underway. However, the market has ignored both fundamentals and macroeconomics for three months and is now also ignoring geopolitics, working selectively with factors. We do not consider the recent decline in the British currency justified, but the technical picture indicates a continuation of the downward trend.
For July 1, we highlight the following important levels: 1.3042-1.3050, 1.3096-1.3115, 1.3179-1.3187, 1.3301-1.3309, 1.3369-1.3377, 1.3465-1.3480, 1.3588, 1.3671-1.3681. The Senkou Span B line (1.3298) and Kijun-sen line (1.3213) may also serve as sources of signals. It is recommended to set the Stop Loss to break even when the price moves in the correct direction by 20 pips. The Ichimoku indicator lines may shift throughout the day, which should be taken into account when determining trading signals.
On Wednesday, a speech is scheduled by Bank of England Governor Andrew Bailey, who rarely makes bold statements. In the US, the ADP labor market report and the ISM manufacturing index will be released. Additionally, there will be a speech from the new head of the Federal Reserve, Kevin Warsh. There will be many events today, particularly in the second half of the day.
Today, traders may consider short positions targeting 1.3179-1.3187 if the pair bounces from the 1.3301-1.3309 area. Long positions can be opened on a new price bounce from the critical line or the 1.3179-1.3187 range, targeting 1.3301-1.3309.
ForexMart is authorized and regulated in various jurisdictions.
(Reg No.23071, IBC 2015) with a registered office at First Floor, SVG Teachers Co-operative Credit Union Limited Uptown Building, Corner of James and Middle Street, Kingstown, Saint Vincent and the Grenadines
Restricted Regions: the United States of America, North Korea, Sudan, Syria and some other regions.


 コンタクトする

