Analytical Reviews

Forexmart's analytical reviews provide up-to-date technical information about the financial market. These reports range from stock trends, to financial forecasts, to global economy reports, and political news that impact the market.

Disclaimer:  Information provided here to retail and professional clients does not contain and should not be construed as containing investment advice or an investment recommendation or an offer or solicitation to engage in any transaction or strategy in financial instruments. Past performance is not a guarantee or prediction of future performance.

XAU/USD: Dynamics Scenarios for 28.09.2026
22:41 2026-09-28 UTC+00

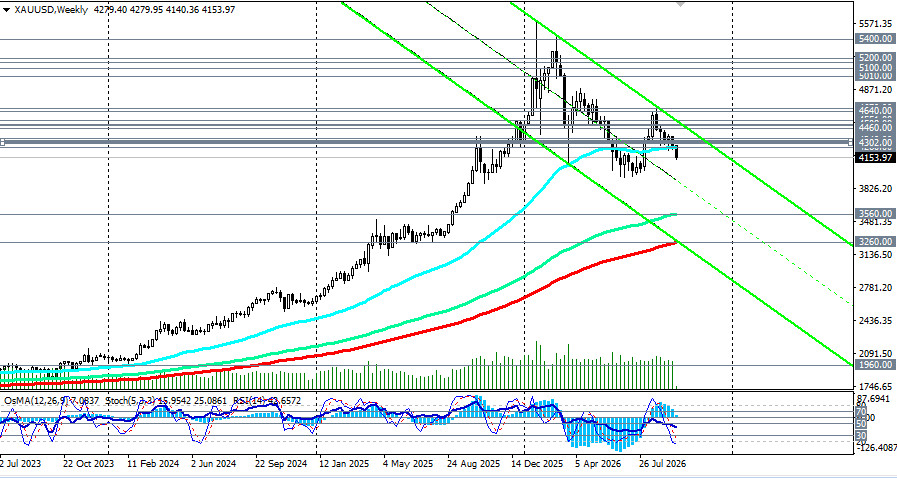
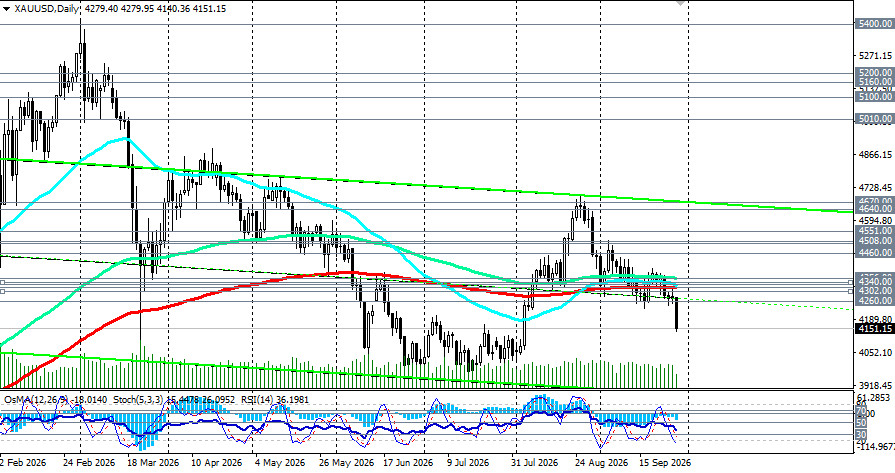
At the start of the US session on Monday, gold trades near an eight-week low and the 4,150.00 mark, remaining under pressure from the oil shock and hawkish Federal Reserve expectations.
analytics6aba5f5f2840d.jpg

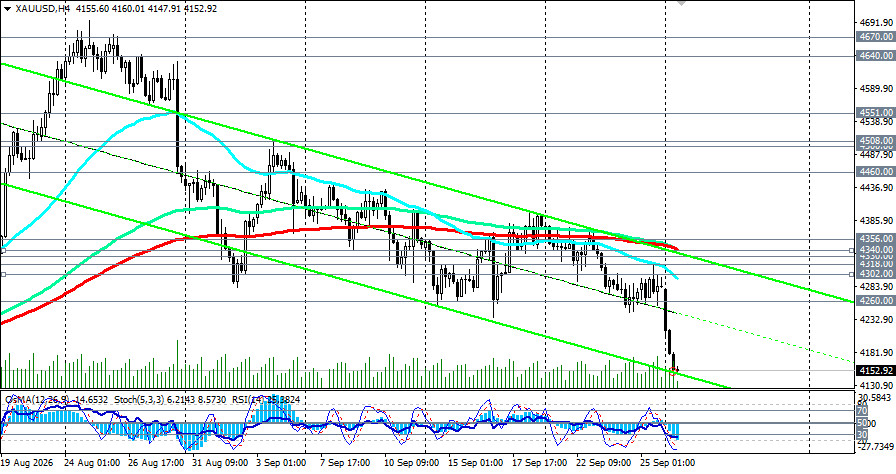
The technical picture remains bearish. Gold trades below key moving averages, and indicators point to ongoing selling pressure, albeit with signs of oversold conditions: RSI(14) on the daily chart is around 36–37, just above the oversold area; on the 4-hour chart, it is near 25, indicating deep oversold readings. OsMA shows a negative histogram confirming seller dominance, and Stochastic sits in the oversold zone, which may foreshadow a technical bounce.

Short positions are favored in the current environment. However, initiating new shorts in the context of strong oversold readings — as with buying — carries elevated risk.
analytics6aba5f6cd0d9f.jpg

At the same time, a signal to initiate new short positions could be today's low at 4,140.00 with a target at 4,100.00. A break below 4,100.00 would open the way to 4,000.00 and then to local support at 3,940.00.

Conditions for the bearish scenario to play out:

  • A decisive break of 4,140.00 and consolidation below it with confirmation from indicators (RSI accelerating downward, OsMA continuing its negative trajectory).
  • Strong PCE data (September 30) or NFP (October 2) confirming persistent inflation and labor-market strength.
  • Continued rise in Treasury yields above 5.25%.
  • Technical confirmation: RSI(14) below 30 and accelerating OsMA decline.

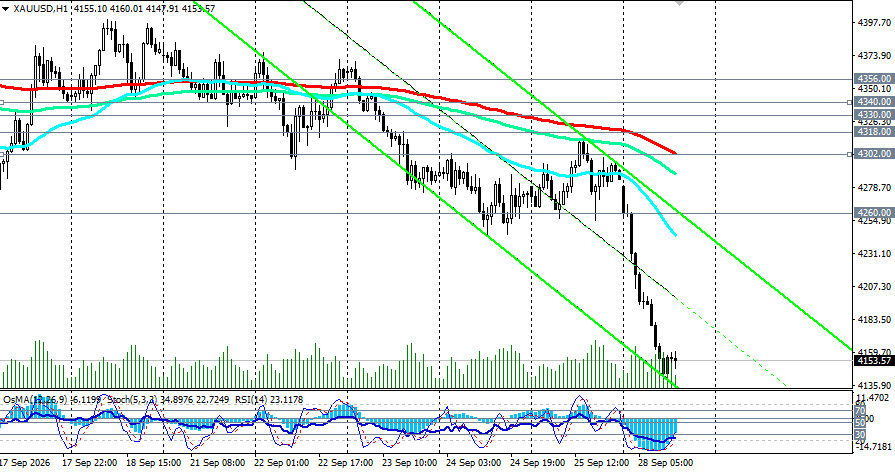
In a rebound, price could climb to the nearest resistance zone at 4,194.00 (200-EMA on the 5-minute chart)–4,200.00. This is the area to take the first tranche of short-profit. A further upside target could be 4,260.00 (50-EMA on the weekly chart). Only a sustained rise above the key resistance at 4,318.00 (200-EMA on the daily chart) would likely restore buyers' confidence and return the price to the mid-term bullish zone.
analytics6aba5f7d2ba6c.jpg

Conditions for the bullish scenario:

  • A sustained rebound from 4,150.00 and consolidation above 4,260.00 with confirmation from indicators (RSI moves above 40 and then above 50; Stochastic leaves the oversold area).
  • Weak US inflation or labor-market data that reduce expectations of a Fed hike in October.
  • A drop in Treasury yields below 5.00% and a weakening dollar.
  • Technical confirmation: RSI(14) above 50 and a slowing decline in OsMA.

Most likely path (base case): consolidation in the 4,150.00–4,260.00 range with a bearish tilt until PCE and NFP are released. A breakout above the upper boundary would open the way to 4,300.00–4,302.00 (200-EMA on H1); a break below the lower boundary would target 4,100.00 and then 4,000.00.

Logic:

  • Gold is under dual pressure: rising oil boosts inflation expectations, which supports a hawkish Fed and higher bond yields, while a strong dollar raises the opportunity cost of holding a non-yielding asset. Unlike its classic safe-haven role, geopolitical tension now works against gold via the oil - inflation - rates channel.
  • Technically, gold is in an oversold phase (RSI around 23 on the 4-hour chart), which may attract buyers on dips. However, a durable reversal requires a catalyst — weak inflation data or a disappointing jobs report. Until then, any bounce is likely to be limited.
  • ANZ notes the macro backdrop remains challenging for gold, but ETF demand stays resilient, providing support at lower levels. The World Bank projects a 37% rise in gold prices in 2026 despite the current correction.

Trading scenarios

  • Bearish (break support): Sell stop 4,138.00. Stop-loss 4,210.00 / 4,260.00. Targets: 4,100.00, 4,050.00, 4,000.00, 3,940.00.
  • Bullish (rebound from support): Buy stop 4,210.00 / 4,260.00. Stop-loss 4,138.00. Targets: 4,298.00, 4,305.00, 4,318.00, 4,340.00, 4,356.00, 4,400.00, 4,540.00.

Note: "Targets" correspond to support/resistance levels. This does not mean they will necessarily be reached, but they can serve as reference points for planning and placing trades.

コメントする

ForexMart is authorized and regulated in various jurisdictions.

(Reg No.23071, IBC 2015) with a registered office at First Floor, SVG Teachers Co-operative Credit Union Limited Uptown Building, Corner of James and Middle Street, Kingstown, Saint Vincent and the Grenadines

Restricted Regions: the United States of America, North Korea, Sudan, Syria and some other regions.



aWS
© 2015-2026 Tradomart SV Ltd.
Top Top
Risk Warning:
Foreign exchange is highly speculative and complex in nature, and may not be suitable for all investors. Forex trading may result in a substantial gain or loss. Therefore, it is not advisable to invest money you cannot afford to lose. Before using the services offered by ForexMart, please acknowledge the risks associated with forex trading. Seek independent financial advice if necessary. Please note that neither past performance nor forecasts are reliable indicators of future results.