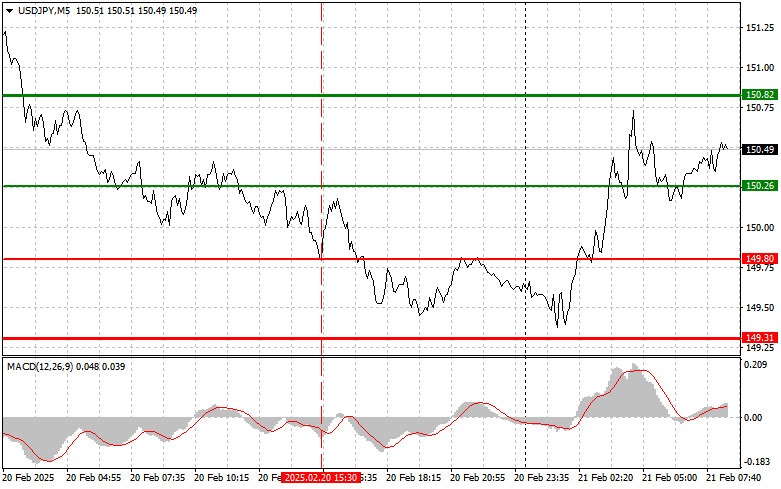
The price test at 149.80 occurred when the MACD indicator had already moved significantly downward from the zero mark, which, in my opinion, limited the pair's further downside potential. For this reason, I did not sell the dollar.
Today, the yen weakened against the dollar after the release of Japan's Consumer Price Index (CPI) data. The figures surpassed economists' forecasts, which typically would bolster expectations for a rate hike by the Bank of Japan. However, this did not happen. Weak readings from Japan's Manufacturing PMI and Composite PMI undermined the positive impact of higher inflation.
Despite inflation exceeding expectations, several factors have prevented decisive action by the central bank. Weak domestic demand and global economic uncertainty continue to exert pressure on the Japanese economy. As a result, the BOJ is likely to take time to evaluate the sustainability of inflationary pressures before deciding on a potential rate hike. In the near term, the dynamics of USD/JPY will be influenced by both domestic Japanese data and global factors, including the policy direction of the Federal Reserve and overall risk sentiment. Investors will be closely watching for any indications regarding the BOJ's next steps, as well as macroeconomic data that could provide insights into the state of the Japanese economy.
Regarding the intraday strategy, I will focus primarily on executing Scenarios #1 and #2.
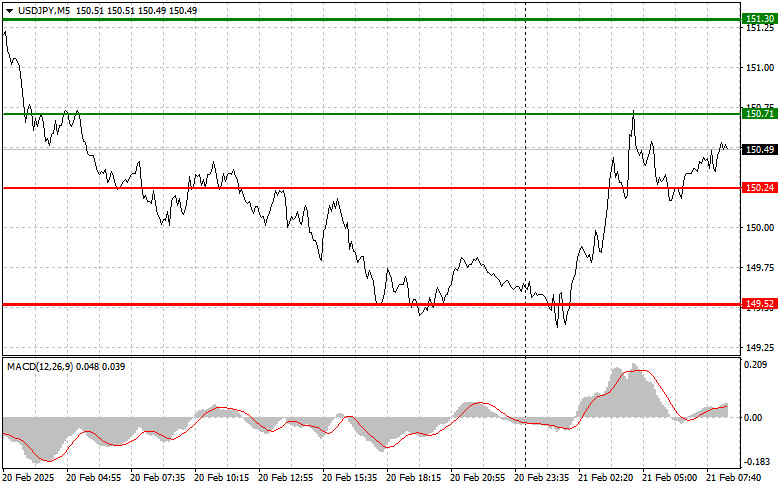
Scenario #1: I plan to buy USD/JPY today when the entry point reaches around 150.70 (green line on the chart), aiming for a rise to 151.30 (thicker green line on the chart). Around 151.30, I plan to exit my buy positions and open sell trades in the opposite direction, targeting a 30-35 pip pullback. It is best to return to buying the pair on corrections and significant drawdowns in USD/JPY. Important! Before buying, ensure that the MACD indicator is above the zero mark and beginning to rise.
Scenario #2: I also plan to buy USD/JPY today if the price of 150.24 is tested twice consecutively while the MACD indicator is in the oversold zone. This will limit the pair's downside potential and lead to an upward market reversal. A rise to the opposite levels of 150.71 and 151.30 can be expected.
Scenario #1: I plan to sell USD/JPY today only after the 150.24 level (red line on the chart) is breached, which will lead to a sharp decline in the pair. The key target for sellers will be 149.52, where I plan to exit my sell positions and immediately open buy trades in the opposite direction, targeting a 20-25 pip pullback. Pressure on the pair can return at any moment. Important! Before selling, ensure that the MACD indicator is below the zero mark and beginning to decline.
Scenario #2: I also plan to sell USD/JPY today if the price of 150.71 is tested twice consecutively while the MACD indicator is in the overbought zone. This will limit the pair's upside potential and lead to a market reversal downward. A decline to the opposite levels of 150.24 and 149.52 can be expected.

SZYBKIE LINKI
ForexMart is authorized and regulated in various jurisdictions.
(Reg No.23071, IBC 2015) with a registered office at Shamrock Lodge, Murray Road, Kingstown, Saint Vincent and the Grenadines
Restricted Regions: the United States of America, North Korea, Sudan, Syria and some other regions.


 Skontaktuj się z ForexMart

