The EUR/USD currency pair mostly traded sideways on Monday, although the euro made attempts to push upward throughout the day. The only significant macroeconomic event was the industrial production report from Germany, which came in slightly stronger than expected. However, this report, like all the events from the previous week—whether strong or weak—did not alter the overall trend, as the euro continued to rise. We believe that the industrial production data from just one of the 27 EU countries had limited impact on the pair's movement.
Overall, the euro remains near its multi-month highs. The pair is not moving downward, while upward momentum lacks any new tariff announcements from Donald Trump. Although the European currency has surged, market participants are uncertain about the next steps. If the U.S. economy heads toward a recession, the dollar should be sold. However, it's unclear if that will happen. Similarly, if Trump imposes new tariffs, the dollar should also be sold, but that remains to be seen. There are currently too many uncertainties. Given the state of the European and American economies, it's puzzling why the dollar has weakened. While Donald Trump is a significant factor, there are no clear negative indicators in the U.S. economy at this time.
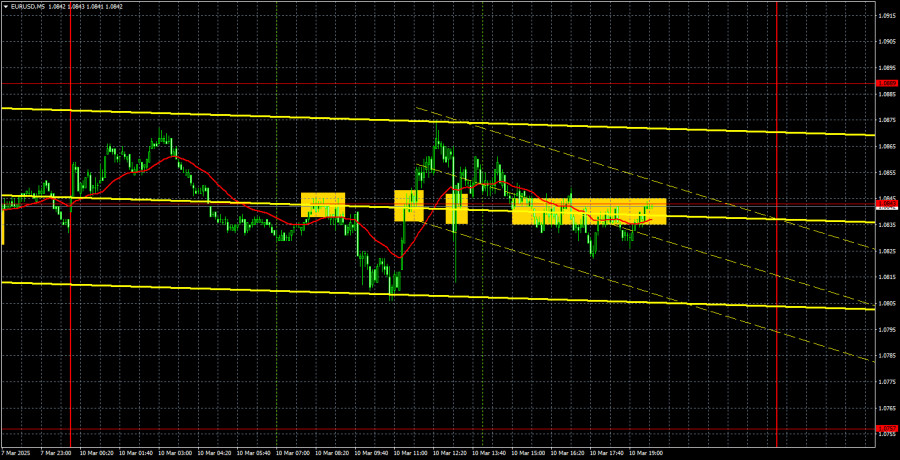
Several trading signals appeared on the 5-minute timeframe, but the price largely moved sideways throughout the day in a choppy manner, ignoring the 1.0843 level entirely. The first two signals turned out to be false, but they were not unprofitable, as the price moved at least 15 pips in the right direction each time. Any subsequent signals were best ignored.
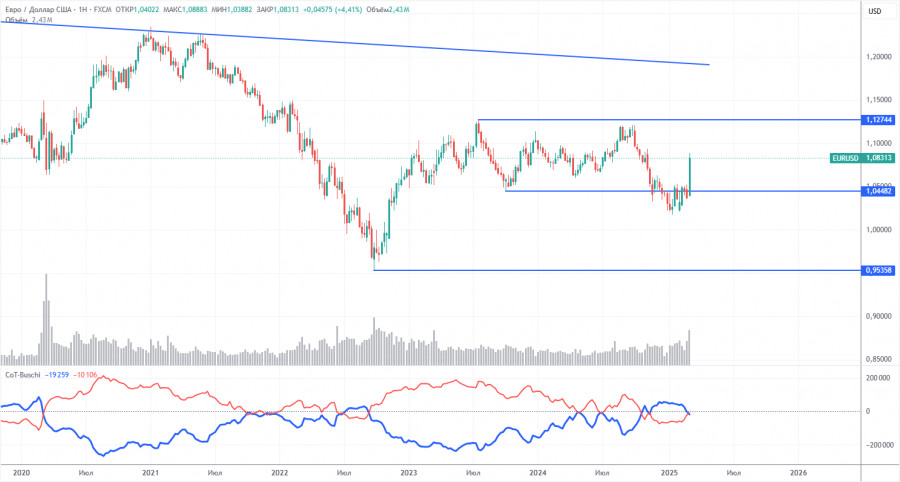
The latest Commitment of Traders (COT) report is dated March 4. The illustration above clearly shows that the net position of non-commercial traders has remained bullish for an extended period; however, bears have recently gained the upper hand. Four months ago, the number of open short positions held by professional traders sharply increased, causing the net position to turn negative for the first time in a long time. This indicates that the euro is now being sold more frequently than it is being bought. Nevertheless, the advantage of the bears is quickly diminishing following Trump taking office as the U.S. president.
Currently, we do not observe any fundamental factors that would support a strengthening of the euro. However, one significant factor has emerged that is contributing to the decline of the U.S. dollar. It is possible that the pair will continue to correct for several more weeks or months, but the 16-year downtrend is unlikely to reverse quickly.
At this point, the red and blue lines have crossed again, indicating that the market trend is now neutral. During the last reporting week, the number of long positions in the "non-commercial" group increased by 2,500, while the number of short positions decreased by 12,800. As a result, the net position increased by another 15,300 contracts.
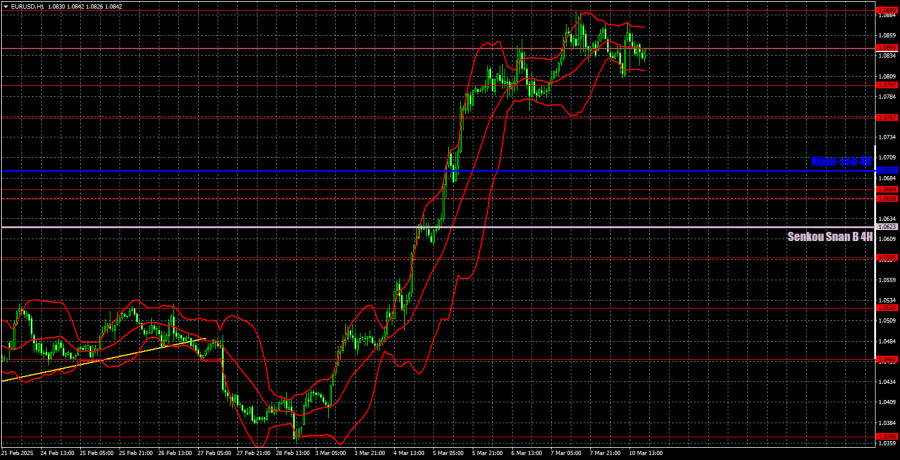
In the hourly time frame, the price continues its steep upward trajectory. We believe that a decline will resume in the medium term due to differences in ECB and Fed monetary policies, but it's unclear how long the market will continue reacting to the Trump factor. The current movement is pure market panic, and its final destination remains unknown. Traders ignore everything except Donald Trump's statements, and the dollar is being sold at any price. The movement is nearly vertical.
For March 11, we highlight the following levels for trading: 1.0269, 1.0340-1.0366, 1.0461, 1.0524, 1.0585, 1.0658-1.0669, 1.0757, 1.0797, 1.0843, 1.0889, 1.0935, as well as the Senkou Span B (1.0623) and Kijun-sen (1.0692) lines. The Ichimoku indicator lines may shift throughout the day, which should be considered when identifying trade signals. Setting a Stop Loss to break even if the price moves at least 15 pips in the correct direction to minimize potential losses in case of a false signal is crucial.
On Tuesday, the only significant event will be the JOLTs job openings report in the U.S. It's hard to say whether traders even care about this report right now. Regardless of its outcome, what can we expect from the dollar—growth or a 30-40 pip move that won't change anything? The key issue is understanding the dollar's long-term outlook, which largely depends on Donald Trump.

SZYBKIE LINKI
ForexMart is authorized and regulated in various jurisdictions.
(Reg No.23071, IBC 2015) with a registered office at Shamrock Lodge, Murray Road, Kingstown, Saint Vincent and the Grenadines
Restricted Regions: the United States of America, North Korea, Sudan, Syria and some other regions.


 Skontaktuj się z ForexMart

