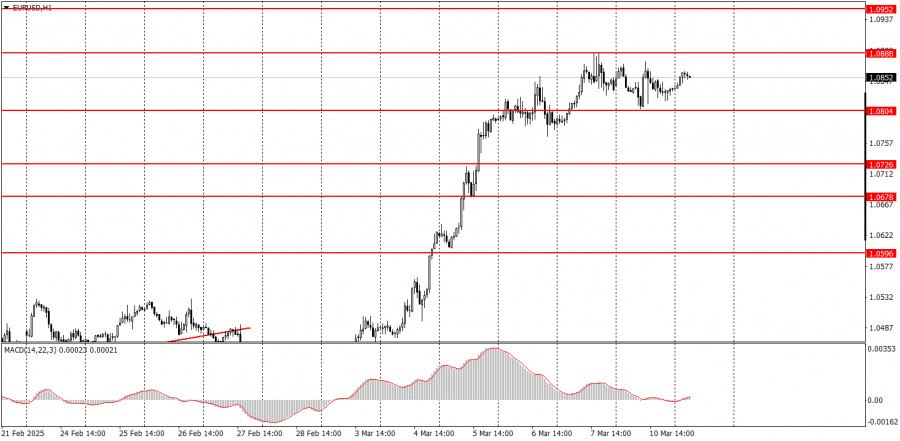
The EUR/USD currency pair traded within the range of 1.0804 to 1.0888 on Monday. The market is currently experiencing a temporary calm after last week's sharp surge, during which the euro appreciated by approximately 500 pips, marking its strongest rally in years. However, traders now face a dilemma: should they continue selling the dollar or start buying it again? Although Trump's sanctions have been accounted for, there could be additional sanctions in the future. The U.S. dollar weakened in anticipation of an economic contraction due to tariffs, but the actual contraction may be mild or nonexistent. The market has already reacted strongly to negative news for the dollar, making it unlikely that its decline will continue at the same pace. A correction appears to be reasonable at this stage.
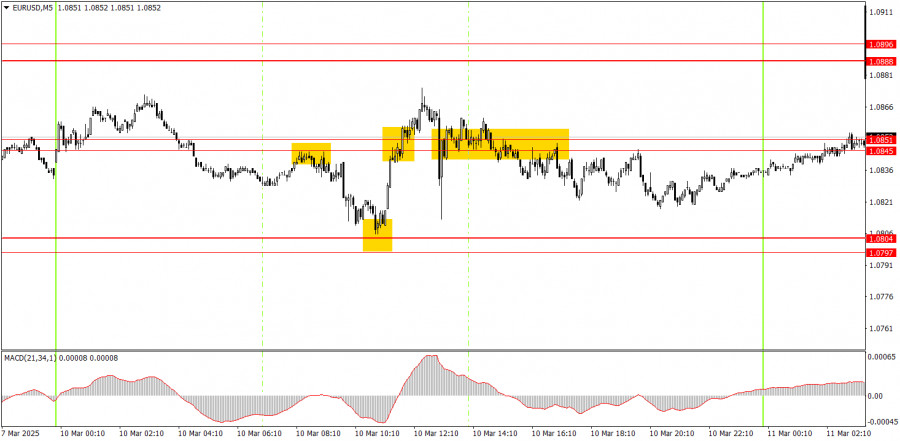
On the 5-minute chart, several trading signals emerged on Monday. The first two signals were quite promising, with the price bouncing off the 1.0845-1.0851 area and reaching the nearest target at 1.0797-1.0804. This bounce from the specified zone allowed traders to take long positions, which also hit their closest target. However, following this, the market became chaotic. While the first two trades could have been closed at a profit, the subsequent signals were largely more loss-making than profitable.
On the hourly timeframe, EUR/USD remains in a medium-term downtrend. Since the fundamental and macroeconomic backdrop continues to favor the U.S. dollar more than the euro, further decline is expected. We are seeing not euro strength but rather dollar weakness driven by Donald Trump's policies. There are no other apparent reasons for the pair's growth, and this factor alone cannot keep pushing the dollar down indefinitely.
On Tuesday, the euro could move in either direction, as the macroeconomic and fundamental background currently has little impact on price movement. The pair's direction will depend on Trump's new statements and technical analysis.
Key levels to consider on the 5-minute timeframe include 1.0334-1.0359, 1.0433-1.0451, 1.0526, 1.0596, 1.0678, 1.0726-1.0733, 1.0797-1.0804, 1.0845-1.0851, 1.0888-1.0896, and 1.0940-1.0952. The only notable economic report on Tuesday is the U.S. JOLTs job openings data, which reflects the number of vacancies from two months ago. This is not a particularly significant report. A correction is the most likely scenario if Trump does not announce new tariffs today.
Support and Resistance Levels: These are target levels for opening or closing positions and can also serve as points for placing Take Profit orders.
Red Lines: Channels or trendlines indicating the current trend and the preferred direction for trading.
MACD Indicator (14,22,3): A histogram and signal line used as a supplementary source of trading signals.
Important Events and Reports: Found in the economic calendar, these can heavily influence price movements. Exercise caution or exit the market during their release to avoid sharp reversals.
Forex trading beginners should remember that not every trade will be profitable. Developing a clear strategy and practicing proper money management are essential for long-term trading success.

SZYBKIE LINKI
ForexMart is authorized and regulated in various jurisdictions.
(Reg No.23071, IBC 2015) with a registered office at Shamrock Lodge, Murray Road, Kingstown, Saint Vincent and the Grenadines
Restricted Regions: the United States of America, North Korea, Sudan, Syria and some other regions.


 Skontaktuj się z ForexMart

