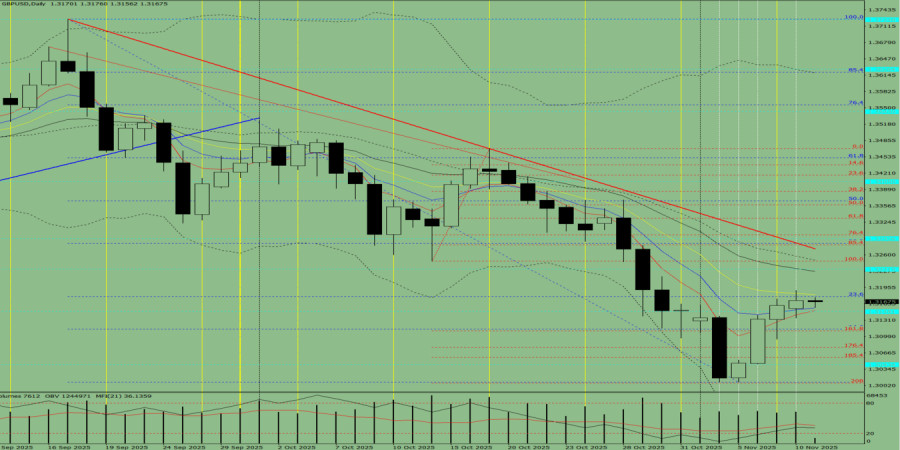
On Tuesday, from the level of 1.3184 (the close of yesterday's daily candle), the market may begin to move downward with a target of 1.3110 – the 161.8% target level (red dashed line). When testing this level, the price may possibly begin to move upward with a target of 1.3148 – the historical resistance level (blue dashed line).
Fig. 1 (Daily Chart)
Overall conclusion: downward trend.
Alternative scenario:From the level of 1.3184 (the close of yesterday's daily candle), the price may begin to move downward with a target of 1.3077 – the 176.4% target level (red dashed line). Upon testing this level, the price may possibly begin to move upward toward 1.3110 – the 161.8% target level (red dashed line).

SZYBKIE LINKI
ForexMart is authorized and regulated in various jurisdictions.
(Reg No.23071, IBC 2015) with a registered office at First Floor, SVG Teachers Co-operative Credit Union Limited Uptown Building, Corner of James and Middle Street, Kingstown, Saint Vincent and the Grenadines
Restricted Regions: the United States of America, North Korea, Sudan, Syria and some other regions.


 Skontaktuj się z ForexMart

