Ekonomika Německa v prvním čtvrtletí vzrostla výrazně více, než se původně předpokládalo, a to díky růstu exportu a průmyslové výroby, které předběhly zavedení amerických cel. Vyplývá to z revidovaného odhadu zveřejněného v pátek.
Ekonomika vzrostla o 0,4 % oproti předchozímu čtvrtletí, zatímco předběžný odhad uváděl jen 0,2 %.
Ve čtvrtém čtvrtletí 2024 německá ekonomika klesla o 0,2 %, což opět vyvolalo obavy z recese (definované jako dvě po sobě jdoucí čtvrtletí poklesu).
Prezidentka statistického úřadu Ruth Brand uvedla, že výrobní výstup a vývoz rostly rychleji, než se původně předpokládalo. Američtí dovozci totiž uspíšili objednávky kvůli obavám z cel.
Německá ekonomika tak překonala průměr eurozóny, která ve Q1 rostla o 0,3 %.
„Dnešní čísla nám připomněla, že německá ekonomika umí stále překvapit pozitivně,“ uvedl Carsten Brzeski z ING, ale dodal, že pravděpodobně šlo o výjimečný vývoj.
Podle Hamburské komerční banky bude Q2 pravděpodobně slabší, protože efekt předzásobení byl klíčovým faktorem růstu.
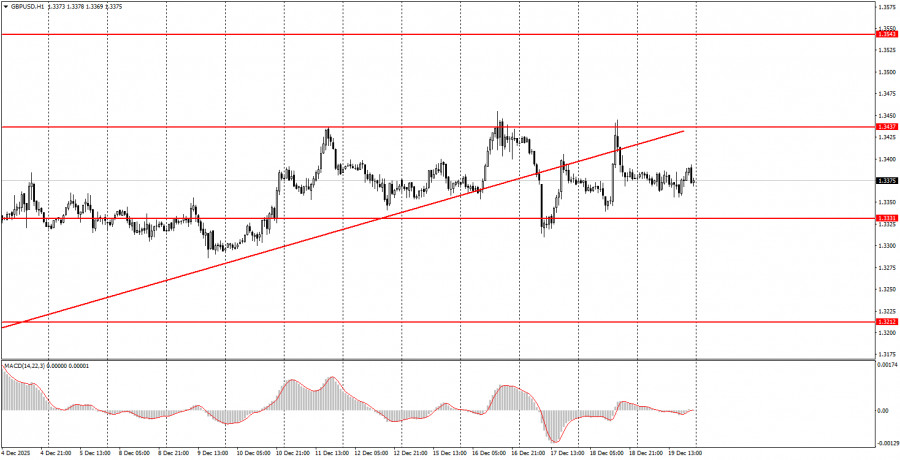
The GBP/USD pair traded even worse on Friday than the EUR/USD pair. Furthermore, another flat range has formed in the British currency, clearly visible on the hourly timeframe. For seven consecutive days, the quotes have been within the range of 1.3331-1.3437. What is this, if not a flat? This week, significant macroeconomic information was published in the UK and the U.S., and there was also the Bank of England meeting, the results of which are not trivial by any means. If reports on inflation, unemployment, and business activity indices, along with the BoE meeting, failed to trigger a trend or volatility, how can we characterize the current market sentiment? Only as a complete unwillingness to trade in principle. Thus, the key feature for the pound right now is the flat on the hourly timeframe. The ascending trend line has been broken, but that no longer matters. Any flat seems to deviate from the overall trend. After the flat concludes, the pair's growth may easily resume.
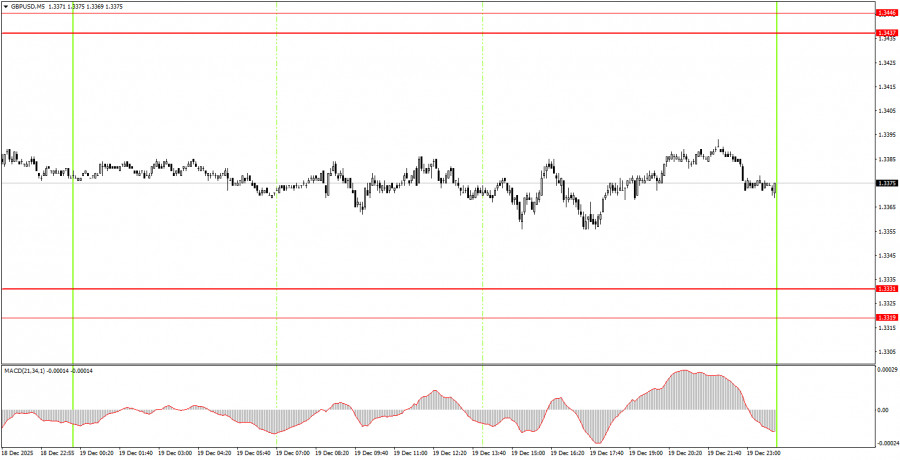
On the 5-minute timeframe, no trading signals were formed on Friday. Throughout the day, the price did not even come close to areas of interest. There were no reasons for beginners to enter the market.
On the hourly timeframe, the GBP/USD pair may enter a downward correction, as the trendline has been broken. However, over the past 1.5 weeks, a flat has formed in the market. As we have already noted, there are no global factors driving medium-term dollar growth, so we anticipate movement only to the upside. Overall, we also expect the resumption of the global upward trend of 2025, which could lead the pair to the 1.4000 mark within the next couple of months.
On Monday, beginner traders may consider new long positions if the price bounces from the area of 1.3319-1.3331 or breaks through the area of 1.3437-1.3446. A bounce from the area of 1.3437-1.3446 or a consolidation below 1.3319-1.3331 would make shorts relevant.
On the 5-minute timeframe, levels to consider now include 1.2913, 1.2980-1.2993, 1.3043, 1.3096-1.3107, 1.3203-1.3212, 1.3259-1.3267, 1.3319-1.3331, 1.3437-1.3446, 1.3529-1.3543, and 1.3574-1.3590. On Monday, the UK is scheduled to publish the third-quarter GDP report, which is not expected to spark much interest. In the U.S., the event calendar is empty, so we expect low volatility and the continuation of the flat.
Important Note: Significant speeches and reports (always included in the news calendar) can greatly influence the movement of the currency pair. Therefore, during their release, it is advisable to trade cautiously or exit the market to avoid sharp reversals against the preceding movement.
Remember: For beginners trading in the Forex market, it is important to understand that not every trade can be profitable. Developing a clear strategy and practicing money management are keys to long-term trading success.

SZYBKIE LINKI
ForexMart is authorized and regulated in various jurisdictions.
(Reg No.23071, IBC 2015) with a registered office at First Floor, SVG Teachers Co-operative Credit Union Limited Uptown Building, Corner of James and Middle Street, Kingstown, Saint Vincent and the Grenadines
Restricted Regions: the United States of America, North Korea, Sudan, Syria and some other regions.


 Skontaktuj się z ForexMart

