The EUR/USD currency pair attempted to extend its upward move on Monday but ran into an insurmountable barrier in the 1.1750-1.1760 area. Recall that the pair previously broke the trend line, so the trend has formally changed to downward. However, earlier, the Senkou Span B line was below, which led us to doubt the continuation of the upward trend. Now the line is above the price, thus acting as resistance. Therefore, the chances of a new downward trend are increasing. There was no macroeconomic or fundamental backdrop on Monday, nor were there any geopolitical events. The pair moved purely based on technical factors throughout the day.
On the hourly timeframe, the European currency has every chance to continue the decline that began last week. Now it faces significantly more important resistance levels than support levels. Thus, a decline to the area of 1.1657-1.1666 can be expected in the near future. This week has many important events scheduled, but most are in the second half. In the first half, the price will move based on technical factors.
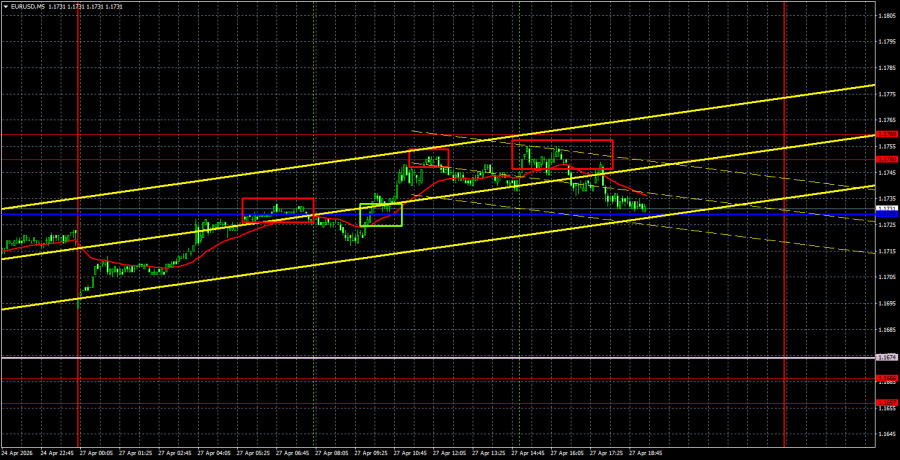
In the 5-minute timeframe yesterday, despite minimal volatility, 4 trading signals were generated. Essentially, the pair spent the entire day between the Kijun-sen line and the area of 1.1750-1.1760, with a distance between them not exceeding 21 pips. Consequently, all "internal" signals in this area had little significance for execution. Nonetheless, three out of four signals resulted in hitting target levels/lines/areas.
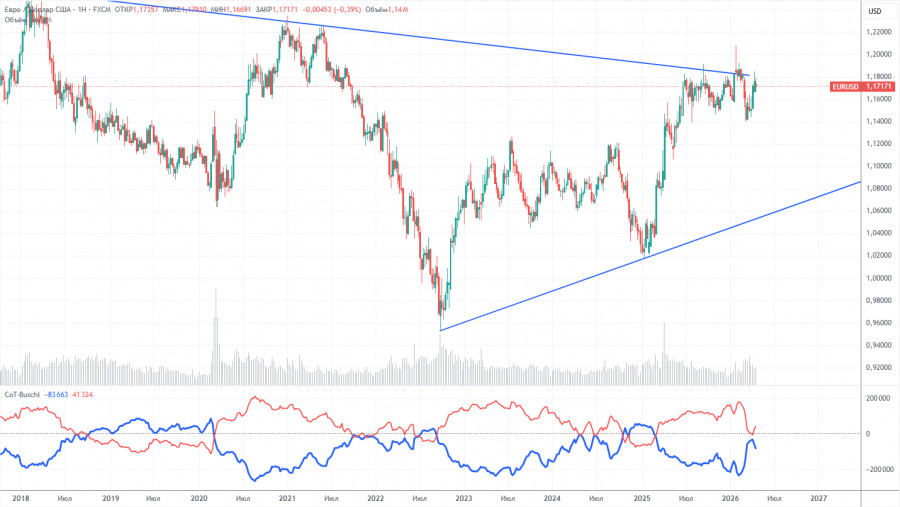
The latest COT report is dated April 21. The illustration of the weekly timeframe clearly shows that the net position of non-commercial traders remains "bullish," but is rapidly declining due to geopolitical events. Traders have been shedding the European currency in favor of the U.S. dollar in recent months. Trump's policy has not changed, but the dollar has acted as a "reserve currency" for some time. However, this process may already be behind us.
We still do not see any fundamental factors supporting the strengthening of the European currency, while there are plenty of factors for the decline of the U.S. dollar. The war in the Middle East made the dollar temporarily super attractive, but once this factor reaches its "expiration date," everything will revert to the way it was. This expiration may have already occurred. In the long term, the euro could fall as low as 1.06 (the trendline), but the upward trend will still remain relevant. Currently, the pair has not deviated significantly from the descending trendline, which has been breached several times.
The positioning of the red and blue lines of the indicator indicates parity between bulls and bears. In the last reporting week, the number of longs in the "Non-commercial" group increased by 2,700, while the number of shorts decreased by 12,500. Consequently, the net position of non-commercial traders rose by 15,200 contracts over the week.
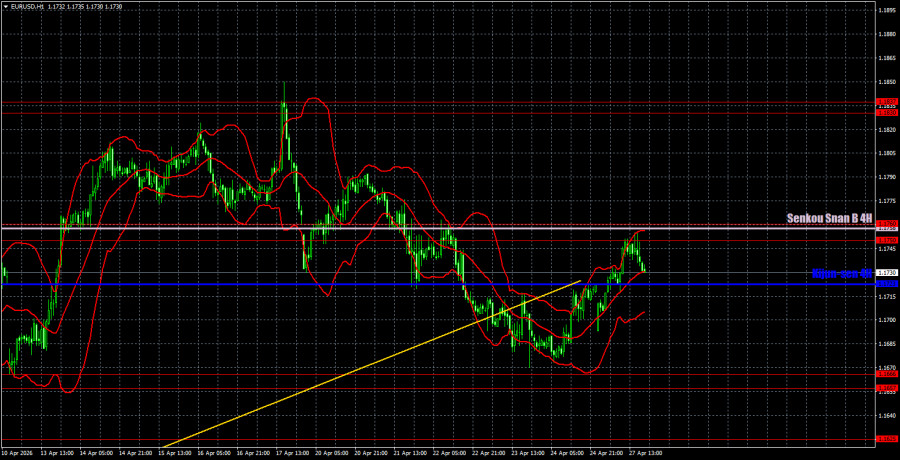
On the hourly timeframe, the EUR/USD pair has begun forming a downward trend. The situation in the Middle East remains tense but is not worsening, so there are currently few strong reasons for the U.S. dollar to strengthen. Many important events are scheduled for this week, so we can expect good volatility. However, the dollar is now in a more advantageous position than the euro.
For April 28, we highlight the following levels for trading: 1.1362, 1.1426, 1.1542, 1.1615-1.1625, 1.1657-1.1666, 1.1750-1.1760, 1.1830-1.1837, 1.1907-1.1922, as well as the Senkou Span B line (1.1758) and the Kijun-sen line (1.1723). The Ichimoku indicator lines may shift during the day, which should be considered when determining trading signals. Don't forget to set a Stop Loss order to breakeven if the price moves 15 pips in the correct direction. This will protect against potential losses if the signal turns out to be false.
On Tuesday, Christine Lagarde, the chair of the European Central Bank, will speak in the Eurozone, but it is unlikely that, just two days before the meeting, she will provide significant information on monetary policy. It is more likely that no important comments will be made. In the US, there will only be a minor weekly ADP report.
On Tuesday, traders may consider opening short positions if the price consolidates below the Kijun-sen line, targeting the 1.1657-1.1666 area. Long positions can be opened if the price consolidates above the area of 1.1750-1.1760, targeting 1.1830-1.1837.
Price levels of support and resistance – thick red lines, around which the movement may end. They are not sources of trading signals.
Kijun-sen and Senkou Span B lines – lines of the Ichimoku indicator that are carried over to the hourly timeframe from the 4-hour one. They are strong lines.
Extreme levels – thin red lines from which the price has previously bounced. They are sources of trading signals.
Yellow lines – trend lines, trend channels, and any other technical patterns.
Indicator 1 on COT charts – the size of the net position of each category of traders.

SZYBKIE LINKI
ForexMart is authorized and regulated in various jurisdictions.
(Reg No.23071, IBC 2015) with a registered office at First Floor, SVG Teachers Co-operative Credit Union Limited Uptown Building, Corner of James and Middle Street, Kingstown, Saint Vincent and the Grenadines
Restricted Regions: the United States of America, North Korea, Sudan, Syria and some other regions.


 Skontaktuj się z ForexMart

