Prodej automobilů v USA ve druhém čtvrtletí poroste díky trvalé poptávce, ale odborníci z oboru předpovídají, že cla prezidenta Donalda Trumpa budou v následujících měsících tlačit ceny nahoru.
Společnost Cox Automotive zabývající se průzkumem trhu očekává, že prodej nových vozidel v USA ve druhém čtvrtletí vzroste oproti loňskému roku o 1,7 % na 4,18 milionu kusů.
„Očekává se, že obavy o dostupnost nových vozů se v druhé polovině roku zhorší v důsledku možného zvýšení cen,“ uvedl Chris Hopson, hlavní analytik společnosti S&P Global Mobility.
Podle společnosti Cox si v tomto čtvrtletí udrží první místo General Motors (NYSE:GM), následovaný severoamerickou divizí Toyota Motor (NYSE:TM) a Fordem.
Krok prezidenta Trumpa uvalit cla na dovoz automobilů do USA zpočátku podpořil poptávku cenově citlivých zákazníků, ale tento efekt by měl s rostoucími cenami slábnout.
„Velká část poptávky, která v dubnu a květnu podpořila prodej, již byla uspokojena, takže v následujících měsících očekáváme oslabení spotřebitelské poptávky,“ uvedl Charlie Chesbrough, senior ekonom společnosti Cox Automotive.
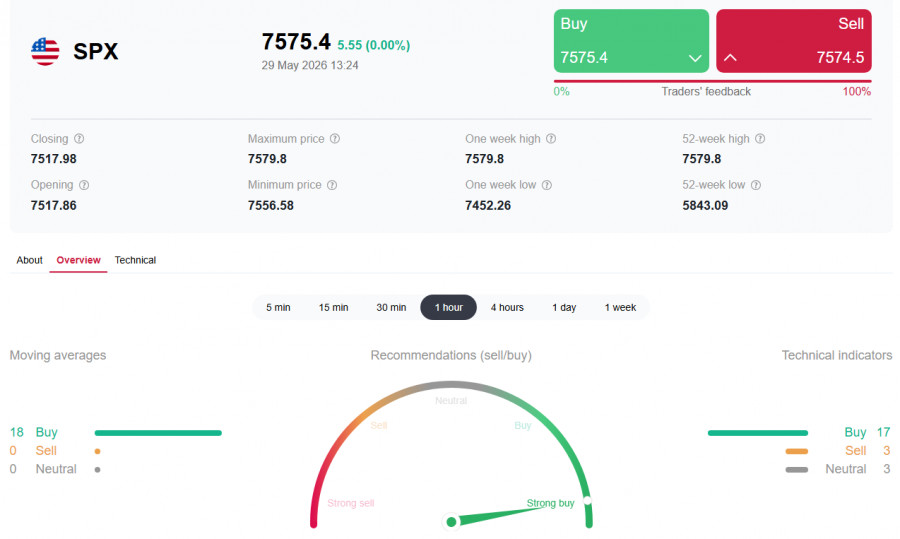
The US stock market is finishing May on a high note. The S&P500 has settled above 7,560.00, extending its winning streak to nine consecutive weeks. Investors are showing remarkable resilience despite renewed geopolitical uncertainty in the Strait of Hormuz and the Fed's obvious hawkish pivot. Technical indicators, however, have been in the oversold zone for more than a week and have begun to flash warning signs of a possible correction.
Fundamental backdrop: ignoring risks
The market continues to discount geopolitical uncertainty, betting on diplomacy. According to Axios, the US and Iran have reached a preliminary agreement on a 60-day ceasefire. That sparked a fresh wave of buying as investors hope the Strait of Hormuz will be reopened and energy markets will stabilize.
The euphoria is tempered by the fact that the deal still requires final approval from US President Donald Trump, who has asked for "a few days" to consider it. Negotiations on Iran's nuclear program and shipping controls remain stalled, and military escalation in the region continues.
While geopolitics creates "noise," the key factor limiting more aggressive gains remains monetary policy. Inflation data published this week showed core PCE accelerating to 3.3%.
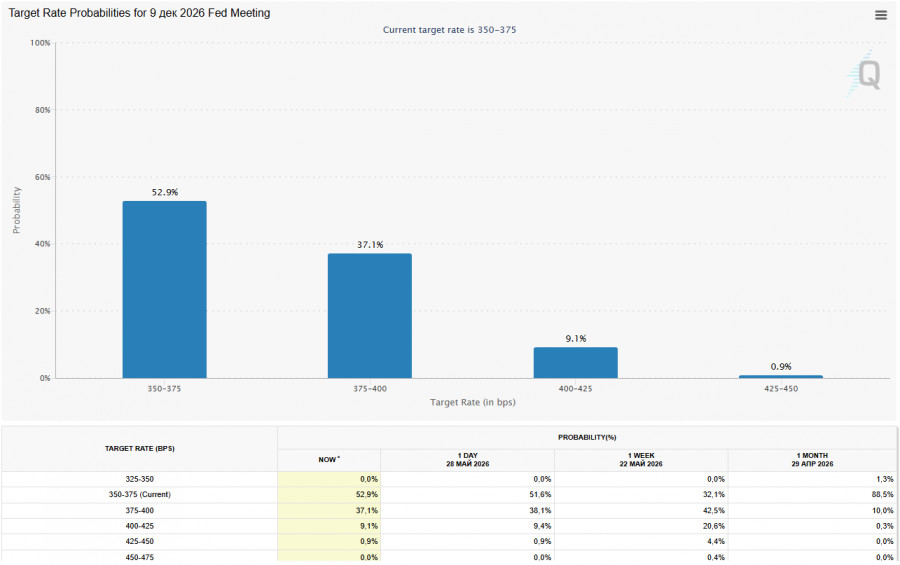
That has reinforced expectations that the Fed not only will refrain from cutting rates but could move to raise them. According to CME FedWatch, the probability of a rate hike before the end of 2026 is roughly 50%.
Economists warn that the "hot" US jobs data (Nonfarm Payrolls) due next week could be the catalyst for an even more hawkish Fed shift.
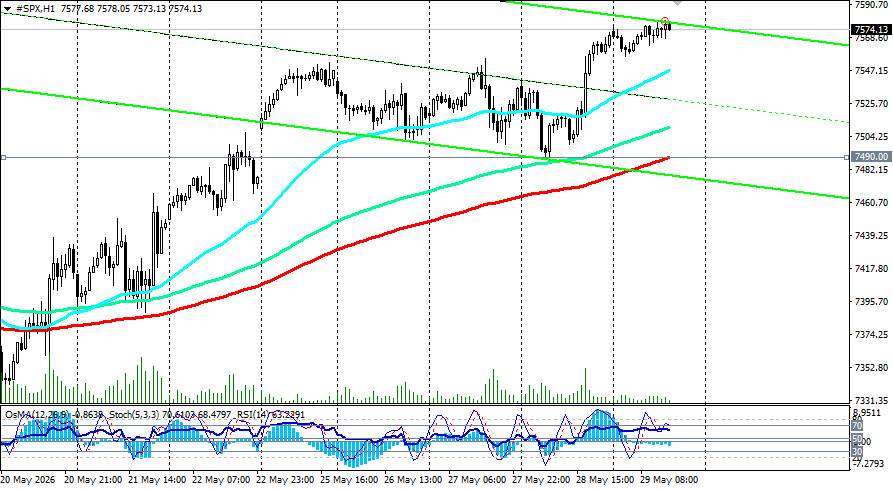
From a technical standpoint, the uptrend remains intact. The nearest target is 7,600.00.
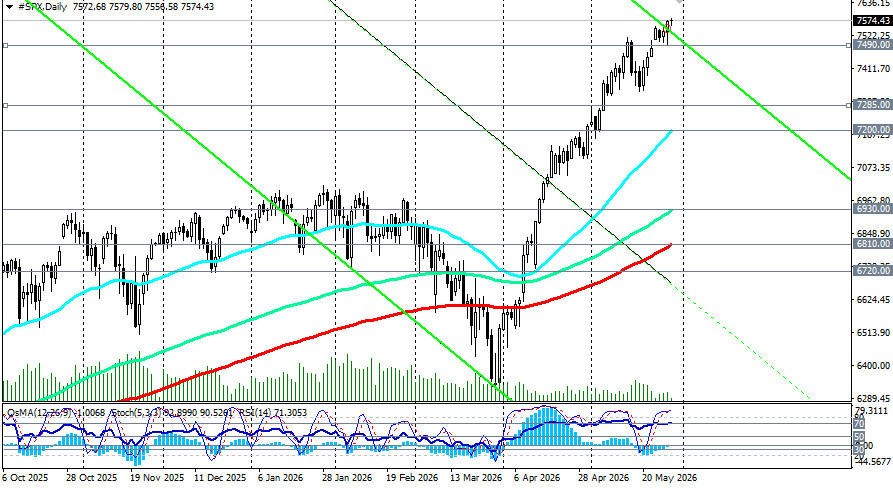
Market analysts note, however, that the number of stocks participation in the rally is shrinking. Only about 60% of S&P500 companies trade above their 200-day moving averages (historical norm — 73%). Only 33% of stocks are outperforming the index this year, approaching extremely low levels.
As noted, technical indicators are in overbought territory after eight weeks of consecutive gains, signaling an overheated market.
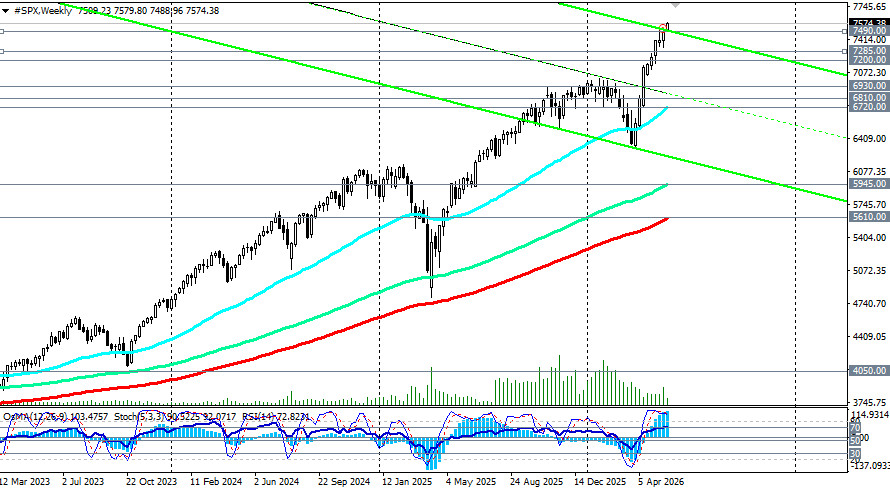
Levels to watch
Earnings season
The quarterly earnings season is virtually over, and results have beaten expectations. S&P500 Q1 EPS came in at 80 versus an expected 70. That, in theory, gives the index room to rise another 800–1,000 points, economists say. The Broadcom (AVGO) report on Wednesday will be the main test for the semiconductor sector, which has been a leader in the rally (+80% from March lows).
Key events next week
| Date | Event | Expected influence |
| Weekend | Waiting for Iran's official response and signing of the agreement |
|
| Wednesday | Broadcom (AVGO) earnings report |
|
| Friday | The US nonfarm payrolls for May | A key macro trigger; consensus is 96k new jobs; a stronger print would reinforce hawkish Fed expectations. |
The S&P500 continues to climb, showing surprising resilience amid geopolitical uncertainty. Corporate earnings, which have significantly exceeded expectations, remain the primary driver. However, technical indicators point to an overheated market. The market is pricing in a peace agreement that has not yet been signed.
The key resistance zone is 7,600.00; a break above would clear the way to 7,700.00. Investors should remain cautious. The coming days will be decisive for the market's direction.
SZYBKIE LINKI
ForexMart is authorized and regulated in various jurisdictions.
(Reg No.23071, IBC 2015) with a registered office at First Floor, SVG Teachers Co-operative Credit Union Limited Uptown Building, Corner of James and Middle Street, Kingstown, Saint Vincent and the Grenadines
Restricted Regions: the United States of America, North Korea, Sudan, Syria and some other regions.











 Skontaktuj się z ForexMart