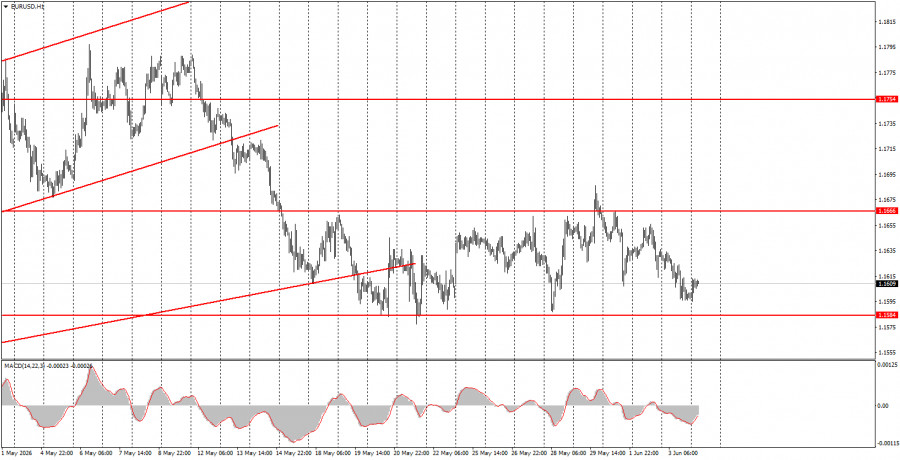
The EUR/USD currency pair continues to trade within a sideways channel, clearly visible on the hourly timeframe. Traders still cannot find grounds to buy or sell the pair. The macroeconomic backdrop is largely ignored, the fundamentals have little significance, and the market is waiting for important geopolitical news and events rather than more threats, ultimatums, and promises. As a result, we have observed the same picture daily for three weeks: there are events and news, but market movements are nearly nonexistent. For instance, yesterday, the ISM services activity index was released in the US, showing a higher-than-expected reading. Additionally, Iran launched new missile strikes against Kuwait. These appear to be two significant events, each of which should have triggered a rise in the US dollar. And the dollar did rise! But by how much? Only 30 pips, and it still remained within the sideways channel.
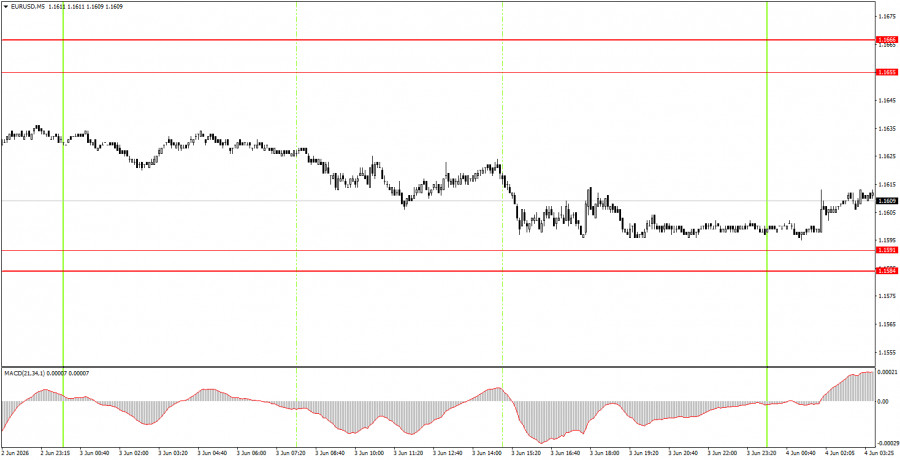
On the 5-minute timeframe on Wednesday, no trading signals were formed. The last sell signals were generated on Tuesday, when the price bounced twice from the 1.1655-1.1666 area. These short positions could have been carried over to Wednesday, since volatility is currently low and the price needs more time to move significant distances.
On the hourly timeframe, the euro has been in a correction for a month and flat for three weeks. The rise of the US dollar has resumed as the conflict in the Middle East is on the brink of escalation, but we still do not expect prolonged growth for the American currency. The market continues to largely ignore fundamentals and macroeconomics, while it reacts to geopolitical issues very selectively.
On Thursday, novice traders can open short positions targeting 1.1527-1.1531 if the price breaks below the 1.1584-1.1591 area. Buy trades can be considered if the price rebounds from the 1.1584-1.1591 area, targeting 1.1655-1.1666.
On the 5-minute timeframe, consider the following levels: 1.1354-1.1363, 1.1413, 1.1455-1.1474, 1.1527-1.1531, 1.1584-1.1591, 1.1655-1.1666, 1.1745-1.1754, 1.1830-1.1837, and 1.1899-1.1908. On Thursday, European Central Bank President Christine Lagarde is scheduled to speak, and a retail sales report will be released. The most important event in the US will be the jobless claims report. We believe that these events will not even provoke an increase in volatility.
Price levels (areas) of support and resistance are targets when opening long or short positions or sources of signals.
Red lines indicate channels or trend lines that display the current trend and indicate the preferred direction for trading.
The MACD indicator (14,22,3) – histogram and signal line – is a supplementary indicator that can also be used as a source of signals.
Important speeches and reports (contained in the news calendar) can significantly impact the movement of the currency pair. Therefore, during their release, trading should be conducted with maximum caution, or one should exit the market to avoid sharp reversals against preceding movements.
Beginners trading in the forex market should remember that not every trade can be profitable. Developing a clear strategy and practicing money management are keys to success in trading over the long term.

SZYBKIE LINKI
ForexMart is authorized and regulated in various jurisdictions.
(Reg No.23071, IBC 2015) with a registered office at First Floor, SVG Teachers Co-operative Credit Union Limited Uptown Building, Corner of James and Middle Street, Kingstown, Saint Vincent and the Grenadines
Restricted Regions: the United States of America, North Korea, Sudan, Syria and some other regions.


 Skontaktuj się z ForexMart

