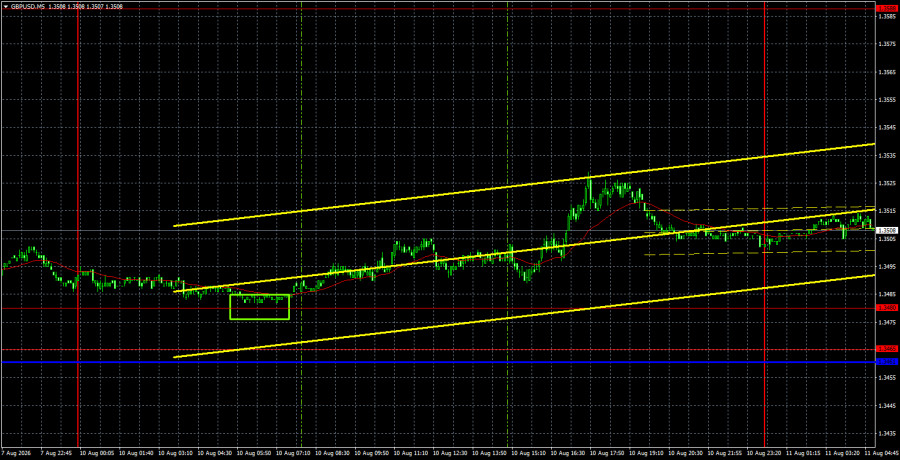
The GBP/USD currency pair experienced a slight downward movement on Monday, showing very weak volatility. Overall, the British currency continues to move upward, unlike the European currency. Thus, the pound sterling is currently feeling more confident than the euro. Why is this happening? In our view, it comes down to energy and geopolitics. The energy crisis caused by the war in Iran has hardly affected the UK. Inflation has risen only slightly, and there are no fuel issues in the UK, as the government took all necessary measures in a timely manner. Therefore, prices have hardly increased, and there is no shortage of energy resources. In the European Union, the situation is drastically different. Gas and oil reserves are rapidly diminishing, while the Strait of Hormuz remains blockaded. We believe that the chances of its reopening "according to Trump" are extremely low. Iran is issuing ultimatums to the US that Donald Trump is unlikely to agree to fulfill. Thus, at best, the conflict will transition to a state of stagnation or freeze. At worst – a new act of escalation and war. Regardless, the Strait of Hormuz will remain closed.
From a technical perspective, the British pound continues to form an upward trend on the hourly timeframe. It should be noted that in the long term, the pair is in a flat, which is clearly visible on the weekly timeframe. After testing the lower boundary of the sideways channel, a logical movement toward the upper boundary began, which has not yet completed and may continue for several more weeks.
On the 5-minute timeframe, one excellent buy signal was formed on Monday. Before the European trading session opened, the pair bounced off the 1.3465–1.3480 area, allowing traders to open long positions. Throughout the day, in contrast to the European currency, the pound showed growth, so by the end of the day, traders could secure a profit of about 15- 20 pips.
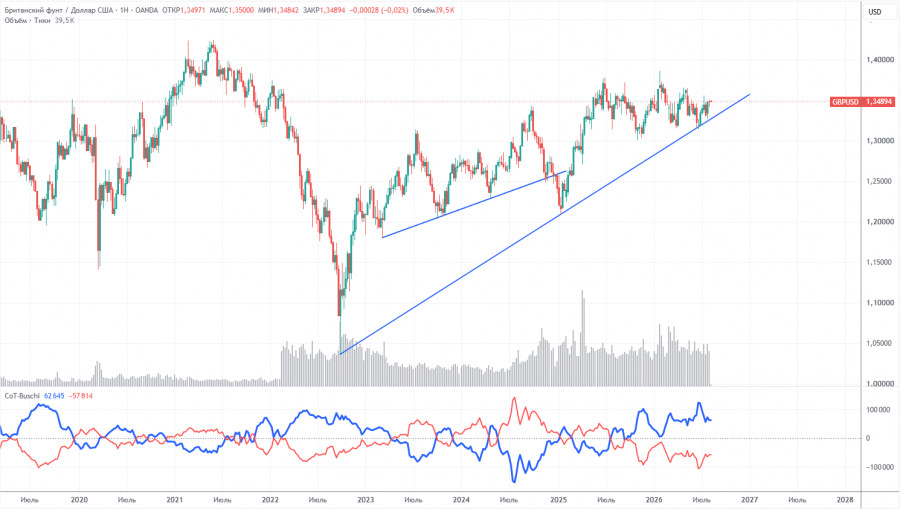
COT reports for the British pound show that non-commercial traders have dominated the market with short positions for several months. The net position is negative despite an upward trend over the long term. Given events in the Middle East, it is not surprising that demand for risk currencies remains weak. The war is formally over, but the conflict continues. It is precisely geopolitics that may support demand for the US dollar in the near term. However, we would not expect a significant decline in the pair until it settles below the trend line.
In the long run, the dollar will continue to weaken due to Trump's policies, as seen on the weekly timeframe. The trade war will continue in one form or another for a long time, and Trump's policies are aimed, directly and indirectly, at weakening the US currency. The long-term uptrend remains, as evidenced by the trend line. The price recently tested this line and bounced off it. According to the latest COT report (dated August 4), the "Non-commercial" group closed 6,500 BUY contracts and 13,500 SELL contracts. Thus, the net position of non-commercial traders increased by 7,000 contracts.
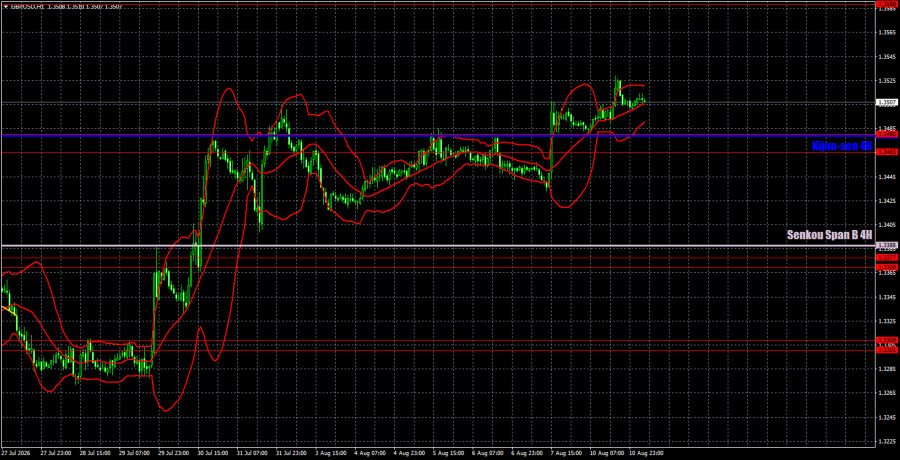
On the hourly timeframe, the GBP/USD pair continues to form an upward trend. In the long term, both European currencies still "look" up and have been in sideways channels for the entire year. This does not negate the upward trend that began back in 2022. We expect the pound to continue rising in the coming weeks.
For August 11, we highlight the following important levels: 1.3042–1.3050, 1.3096–1.3115, 1.3179–1.3187, 1.3301–1.3309, 1.3369–1.3377, 1.3465–1.3480, 1.3588, 1.3671–1.3681. The Senkou Span B line (1.3388) and Kijun-sen (1.3480) may also serve as sources of signals. It is recommended to set the Stop Loss level to breakeven once the price has moved in the correct direction by 20 pips. The Ichimoku indicator lines may shift during the day, which should be taken into account when determining trading signals.
On Tuesday, no important events or publications are scheduled in the UK or the US. Thus, volatility may be low again. The most interesting and nearest report will be released tomorrow—US inflation.
Today, traders may consider short positions targeting 1.3388 if the price consolidates below the 1.3465–1.3480 area and the Kijun-sen line. Long positions can be opened in the event of a new price rebound from the 1.3465–1.3480 area with targets of 1.3588.
Price support and resistance levels are thick red lines near which movement may end. They are not sources of trading signals.
The Kijun-sen and Senkou Span B lines are Ichimoku indicator lines transposed from the 4-hour timeframe to the hourly timeframe. They are strong lines.
Extreme levels are thin red lines from which the price has previously bounced. They are sources of trading signals.
Yellow lines are trend lines, trend channels, and any other technical patterns.
Indicator 1 on COT charts represents the size of the net position of each category of traders.
SZYBKIE LINKI
ForexMart is authorized and regulated in various jurisdictions.
(Reg No.23071, IBC 2015) with a registered office at First Floor, SVG Teachers Co-operative Credit Union Limited Uptown Building, Corner of James and Middle Street, Kingstown, Saint Vincent and the Grenadines
Restricted Regions: the United States of America, North Korea, Sudan, Syria and some other regions.











 Skontaktuj się z ForexMart