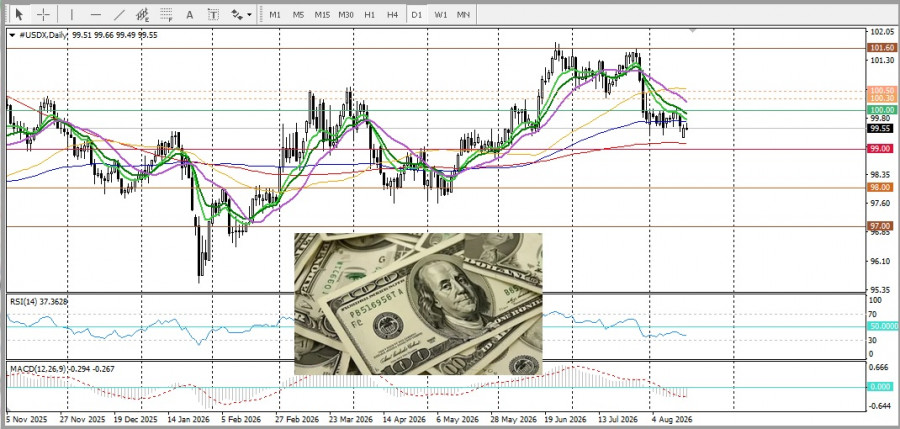
The AUD/USD pair is struggling to hold the round level of 0.7100. The U.S. dollar continues to gain strength, recovering from a two-month low reached on Monday, as inflation concerns driven by rising oil prices increase the likelihood of at least one interest rate hike by the Federal Reserve. Additionally, the confrontation between the U.S. and Iran creates a geopolitical risk premium, further contributing to the dollar's strengthening as a safe-haven asset, which is viewed as a limiting factor for the AUD/USD pair.
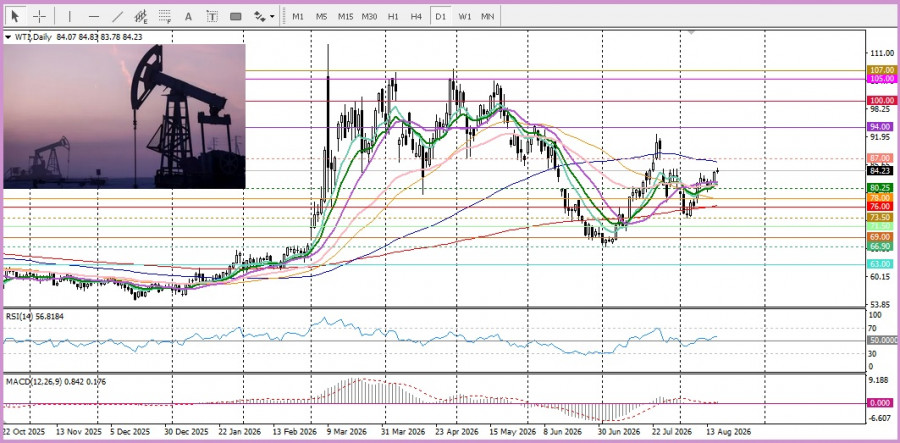
President Donald Trump has stated that the U.S. does not intend to extend the Memorandum of Understanding with Iran, which expired on Monday. Trump has also reiterated his idea of recognizing the Strait of Hormuz as U.S. territory and warned that he will take action against Oman if it interferes with the resumption of shipping through this strategically important waterway. This comes amidst escalating conflict involving Iran-backed Houthi rebels in Yemen against Saudi Arabia, which has contributed to oil prices rising to a two-week high.
Investors remain concerned that rising energy prices may enhance inflationary pressures and compel the U.S. central bank to adopt a more hawkish stance. However, proponents of a stronger dollar may prefer to wait for additional signals about the Fed's future monetary policy. In this regard, attention should focus on the FOMC meeting minutes expected to be released on Wednesday. At the same time, the RBA's hawkish stance may support the Australian dollar and the AUD/USD pair.
Analysts at Rabobank note that RBA Governor Jeremy Bullock promptly responded to the initial weak interpretation of the latest RBA decision, emphasizing that the Council actively considered both maintaining and raising interest rates. Bullock also pointed to a continuing trend of tightening monetary policy, stating that another rate hike is "quite possible."
From a technical standpoint, the AUD/USD pair is fighting for the round level of 0.7100. In the event of a decline, support will come from the 19-day EMA and 100-day SMA. The August high represents resistance. Meanwhile, oscillators are positive, indicating a bullish advantage in the market.
SZYBKIE LINKI
ForexMart is authorized and regulated in various jurisdictions.
(Reg No.23071, IBC 2015) with a registered office at First Floor, SVG Teachers Co-operative Credit Union Limited Uptown Building, Corner of James and Middle Street, Kingstown, Saint Vincent and the Grenadines
Restricted Regions: the United States of America, North Korea, Sudan, Syria and some other regions.











 Skontaktuj się z ForexMart