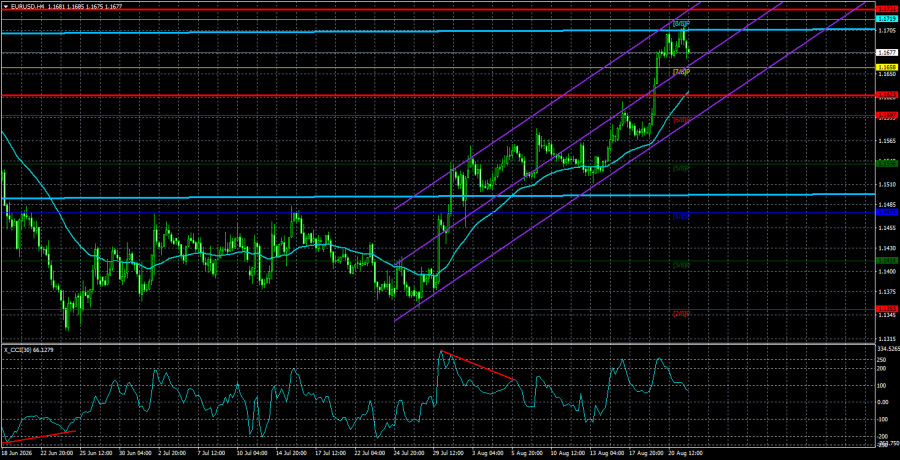
The EUR/USD currency pair rose approximately 100 points over the past week, and the U.S. dollar has once again been quite fortunate. It is worth noting that all of 2026 has been a winning streak for the American currency. If, at the very beginning of the year, the EUR/USD pair hit a new 4-year high, then Donald Trump started a war with Iran, and demand for the U.S. currency rose sharply amid capital flight to a "safe haven." Then, for inexplicable reasons, the market began to expect a tightening of monetary policy by the Federal Reserve, even though Donald Trump seemingly appointed Kevin Warsh for entirely different tasks. These two events allowed the dollar to set a record high of 1.1350 against the euro.
Now let's examine what this record is worth. Transitioning to the weekly timeframe, we aim to identify the segment of the trend in which the U.S. currency is strengthening. Only two segments stand out: from July to September 2023 and from September to December 2024. Both of these segments are pure corrections. But the growth of the U.S. dollar is at least noticeable during these periods. Over the last year, however, the American currency has struggled more than it has grown. This is particularly evident, given that geopolitical factors and market expectations regarding Fed monetary policy have fully supported it. In contrast, many factors favoring the euro have been ignored by the market.
Thus, even under favorable conditions, the dollar has failed to show anything more than a basic corrective pullback in the long term. We understand that on the 4-hour timeframe, the technical picture looks somewhat different. It may seem that the U.S. dollar has been growing all year. However, this is not the case, and analysis should always start from the higher timeframes. Since 2022, an upward trend has been forming for the EUR/USD pair, and it is not yet complete. Consequently, in the long term, we continue to expect only growth for the European currency. Of course, Trump could start a few more wars around the world, but such events cannot be anticipated in advance.
Regarding the fundamental backdrop for the American currency, it remains dire. Last week, the U.S. Treasury announced an expansion of its own QE program, which involves flooding the markets with liquidity by repurchasing long-term bonds that have set yield records since 2007. Now, to service the national debt, the U.S. government will spend about $1 trillion annually. The total U.S. debt surpassed $40 trillion under Trump. This fact alone is sufficient for the U.S. dollar to continue its plunge into the abyss. We don't even find it necessary to analyze all the other events of the past week, as they had no impact on trading. All published reports in the U.S. were initially secondary, while the Fed's minutes are always a formal event, published three weeks after the actual meeting. The information they contain is already somewhat outdated by the time of publication. We continue to believe that the Fed will not tighten policy in the coming months, and we see no factors supporting dollar growth.
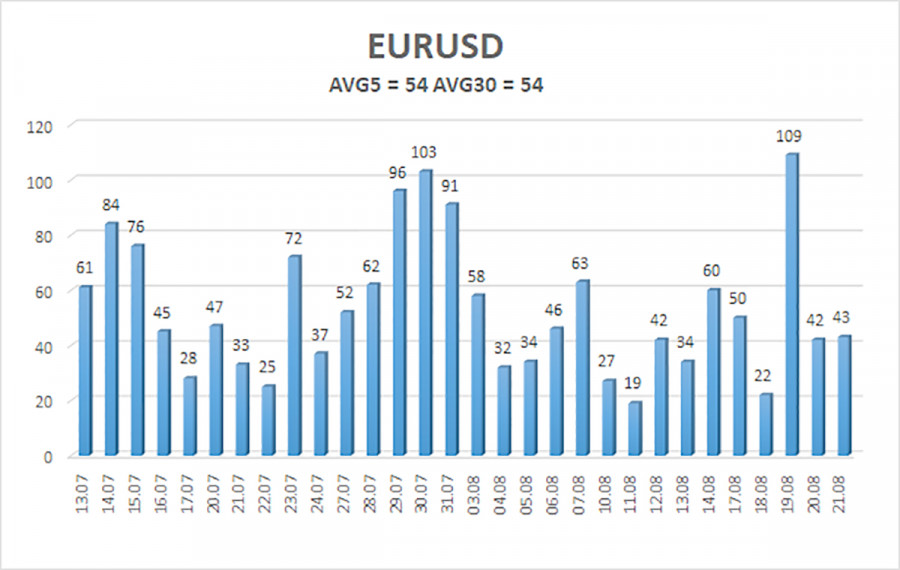
The average volatility of the EUR/USD currency pair over the past 5 trading days, as of August 24, is 54 pips and is considered "average." We expect the pair to move between 1.1623 and 1.1731 on Monday. The higher linear regression channel is sloping downward, indicating that the bearish trend persists, even though the trend has already changed. The CCI indicator has once again entered the overbought area, warning of a potential new downward pullback.
S1 – 1.1658
S2 – 1.1597
S3 – 1.1536
R1 – 1.1719
R2 – 1.1780
R3 – 1.1841
The EUR/USD pair continues its upward trend on the 4-hour timeframe, which may mark the beginning of a new phase in the global uptrend on higher timeframes. The global fundamental backdrop for the dollar remained negative, but in 2026, geopolitical factors, followed by a "hawkish" Fed stance, provided strong support for the American currency. However, these factors no longer support the dollar at this time. When the price is below the moving average, short positions can be considered on corrective grounds with a target of 1.1597. Above the moving average line, long positions remain relevant with targets at 1.1719 and 1.1731.

SZYBKIE LINKI
ForexMart is authorized and regulated in various jurisdictions.
(Reg No.23071, IBC 2015) with a registered office at First Floor, SVG Teachers Co-operative Credit Union Limited Uptown Building, Corner of James and Middle Street, Kingstown, Saint Vincent and the Grenadines
Restricted Regions: the United States of America, North Korea, Sudan, Syria and some other regions.











 Skontaktuj się z ForexMart