Indické akcie v pondělí v ranním obchodování klesaly.
Referenční index 50 akcií Nifty 50 oslabil o 0,21 %, zatímco index BSE Sensex ztratil 0,22 % v 9:30 indického času (12:00 ET).
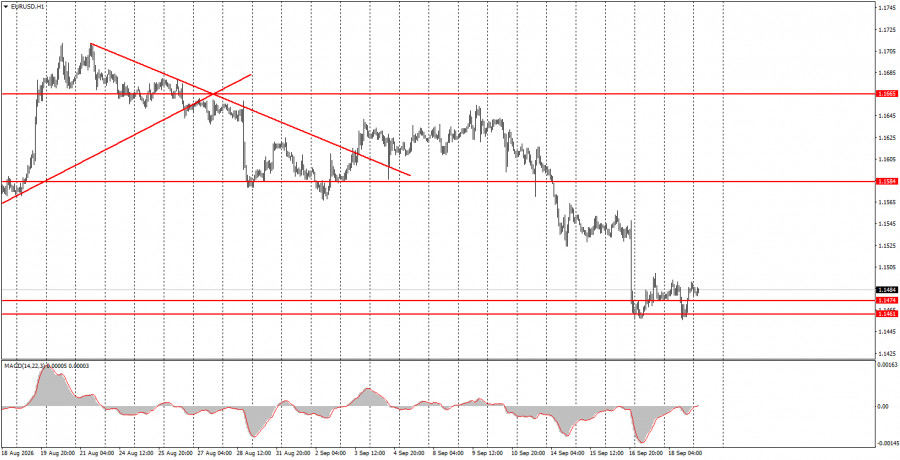
The EUR/USD pair on Friday continued attempting to correct after Wednesday's plunge. Price tested the 1.1461–1.1474 support area twice but failed to break it. Thus, an upward correction has not yet begun, but it is brewing. As always, meaningful reasons are required for further dollar strengthening. In recent weeks, traders actively bought the US dollar on expectations of Federal Reserve tightening. Those expectations were met, but what grounds remain for further dollar appreciation? We currently do not see them. The Fed did take a surprisingly hawkish stance last week, which helped the dollar, but overall the situation for the US currency remains more negative than positive. Recall the ECB is tightening policy as well, so monetary policy is not a dollar-only support factor. We believe the dollar has squeezed as much as it can for now, and a new uptrend for the euro could begin. No major events occurred in the EU or the US on Friday.
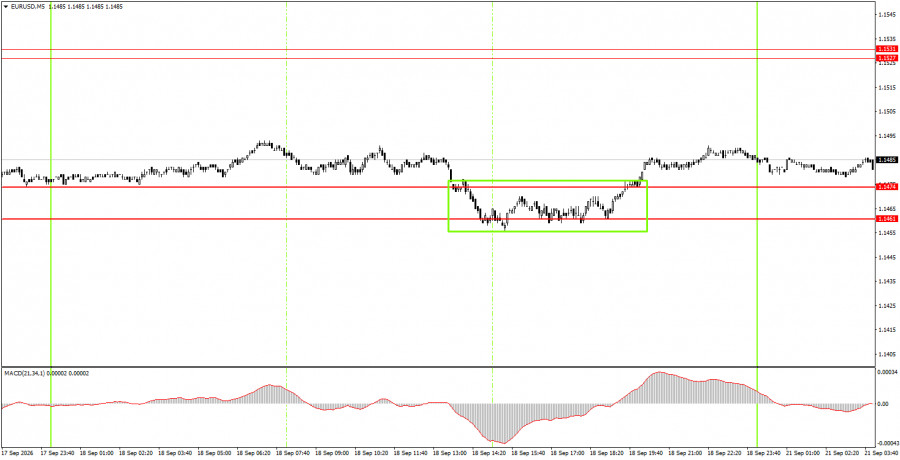
On the 5-minute timeframe on Friday, one trading signal formed. During the US session, price bounced from the 1.1461–1.1474 area — the second bounce this week from that zone. Thus, this week the euro may be tilting toward gains.
On the hourly timeframe, EUR/USD continues a downward trend that may now become a full-blown trend. Considering recent months' events, we do not think the euro should collapse like a stone. But the market's primary focus remains Fed policy, which has become materially more supportive of the US currency. However, that factor cannot support the dollar forever.
On Monday, novice traders may open short positions targeting 1.1366–1.1377 if price consolidates below the 1.1461–1.1474 area. Long positions can be opened targeting 1.1527–1.1531 in case of a bounce from the 1.1461–1.1474 area.
On the 5-minute timeframe, consider the levels 1.1267–1.1275, 1.1366–1.1377, 1.1461–1.1474, 1.1527–1.1531, 1.1584–1.1594, 1.1655–1.1665, 1.1745–1.1754. No major events or releases are scheduled in the EU or the US on Monday, so traders will likely have little to react to during the day. Volatility may again be very low.
Price levels (areas) of support and resistance serve as targets for opening buy or sell trades or as sources of signals.
Red lines indicate channels or trend lines that show the current trend and the preferred trading direction.
The MACD indicator (14,22,3) — the histogram and signal line — is an auxiliary indicator that can also provide signals.
Important speeches and reports (listed in the news calendar) can significantly influence currency pair movements. Therefore, during their release, traders should approach trading with utmost caution, or exit the market to avoid sudden reversals against the preceding move.
Beginner forex traders should remember that not every trade can be profitable. Developing a clear strategy and practicing money management are key to long-term success in trading.

SZYBKIE LINKI
ForexMart is authorized and regulated in various jurisdictions.
(Reg No.23071, IBC 2015) with a registered office at First Floor, SVG Teachers Co-operative Credit Union Limited Uptown Building, Corner of James and Middle Street, Kingstown, Saint Vincent and the Grenadines
Restricted Regions: the United States of America, North Korea, Sudan, Syria and some other regions.











 Skontaktuj się z ForexMart