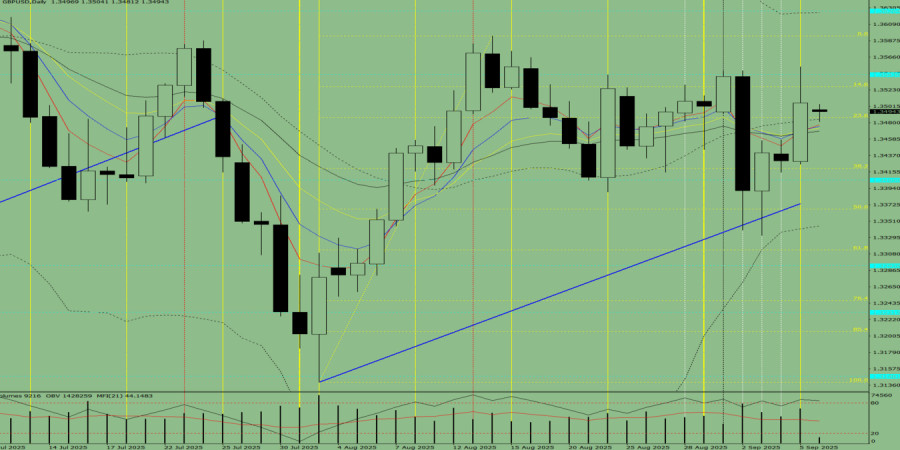
Trend analysis (Fig. 1).
On Monday, from the level of 1.3506 (Friday's daily candle close), the market may begin moving downward with a target of 1.3469 – the 21-day EMA (black thin line). Upon testing this line, the price may begin moving upward with a target of 1.3486 – the 23.6% retracement level (yellow dotted line).
Fig. 1 (daily chart).
Comprehensive analysis:
Overall conclusion: Downtrend.
Alternative scenario: From the level of 1.3506 (Friday's daily candle close), the price may start moving downward with a target of 1.3420 – the 38.2% retracement level (yellow dotted line). Upon testing this level, the price may then move upward with a target of 1.3469 – the 21-day EMA (black thin line).

LINKS RÁPIDOS
ForexMart is authorized and regulated in various jurisdictions.
(Reg No.23071, IBC 2015) with a registered office at First Floor, SVG Teachers Co-operative Credit Union Limited Uptown Building, Corner of James and Middle Street, Kingstown, Saint Vincent and the Grenadines
Restricted Regions: the United States of America, North Korea, Sudan, Syria and some other regions.


 Contate-nos

