Trend analysis (Fig. 1).
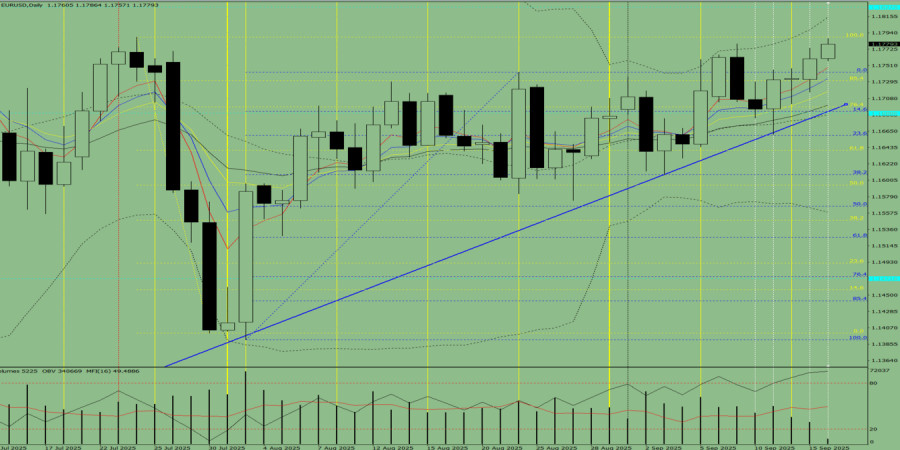
On Tuesday, the market from the level of 1.1760 (closing of yesterday's daily candle) may continue upward movement with the target at 1.1788 – the upper fractal (yellow dotted line). When testing this level, the price may pull back downward to test the upper fractal at 1.1774 (daily candle from 15.09.2025).
Fig. 1 (daily chart).
Comprehensive analysis:
Overall conclusion: upward trend.
Alternative scenario: from the level of 1.1760 (closing of yesterday's daily candle), the price may continue moving upward with the target at 1.1829 – historical resistance level (blue dotted line). When testing this level, the price may pull back downward to test the upper fractal at 1.1788 (yellow dotted line).

LINKS RÁPIDOS
ForexMart is authorized and regulated in various jurisdictions.
(Reg No.23071, IBC 2015) with a registered office at First Floor, SVG Teachers Co-operative Credit Union Limited Uptown Building, Corner of James and Middle Street, Kingstown, Saint Vincent and the Grenadines
Restricted Regions: the United States of America, North Korea, Sudan, Syria and some other regions.


 Contate-nos

