EUR/USD
Analysis:
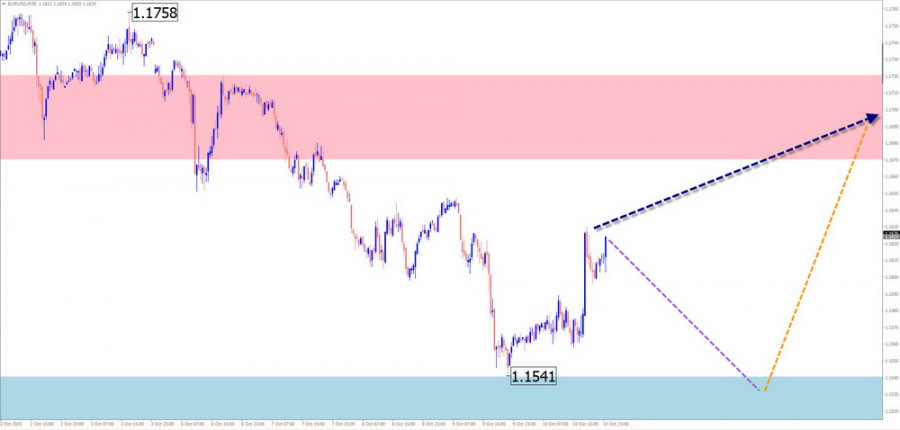
Since late July of this year, an upward trend has been forming on the euro chart. From mid-September, quotes have been retreating downward from the lower boundary of a large-scale potential reversal zone. A counter-trend zigzag has formed on the chart, not exceeding the correction level. At the time of analysis, the wave structure appears complete, but there are no signals indicating an imminent trend change.
Forecast:
Over the coming week, the euro's sideways trend is expected to conclude. Early in the week, pressure on the support zone is likely. Toward the weekend, the probability of a reversal and renewed price growth increases. The resistance zone marks the probable upper limit for the week's movement.
Potential Reversal Zones Resistance:
Support:
Recommendations:
USD/JPY
Analysis:
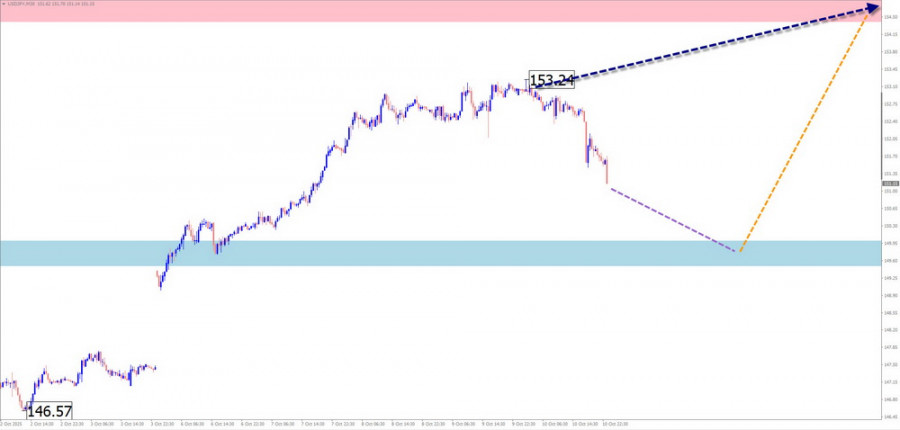
Since April of this year, an upward wave has been forming on the yen chart. The wave structure has created an "ascending pennant" pattern. The unfinished segment has been in progress since October 1. The price has reached the lower boundary of a strong potential reversal zone. No signals of an imminent trend reversal are observed.
Forecast:
In the coming days, the general upward movement is expected to continue up to the resistance zone boundaries. After that, the price is likely to move sideways, forming a reversal and starting a downward correction.
Potential Reversal Zones Resistance:
Support:
Recommendations:
GBP/JPY
Analysis:
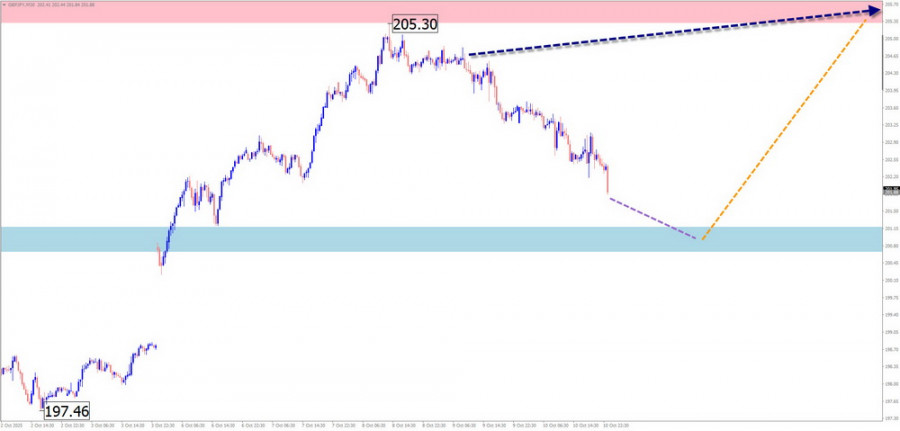
For the past two months, the GBP/JPY pair chart has shown an upward bias. The current main wave began on September 11. The structure is now close to completion, but no immediate reversal signals have formed. In recent days, the price has pulled back downward from the lower boundary of the potential reversal zone.
Forecast:
At the start of the coming week, a decline toward the support zone is expected. After that, a sideways consolidation and subsequent rise toward the resistance zone are likely. This area coincides with a major timeframe potential reversal zone.
Potential Reversal Zones Resistance:
Support:
Recommendations:
USD/CAD
Analysis:
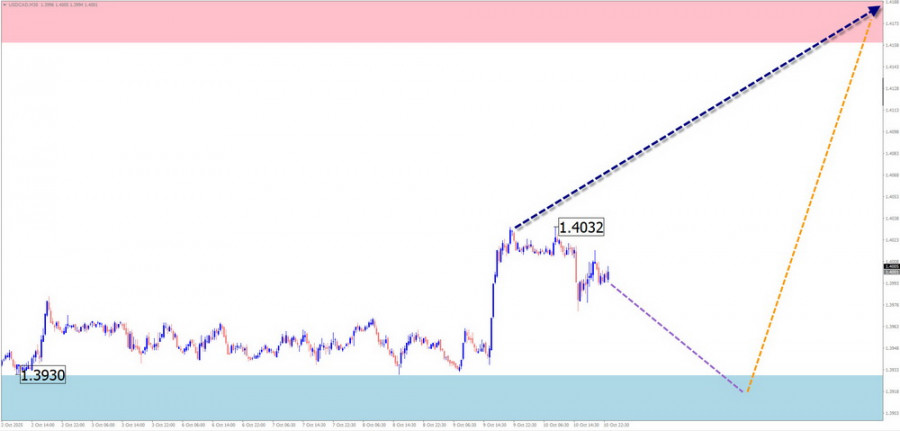
Since February of this year, USD/CAD has been forming a downward wave. The middle section of wave (B) started on June 16 and remains incomplete. The price has broken through intermediate resistance, which now serves as support. Before resuming upward movement, the pair needs to consolidate within a flat range to raise its wave level.
Forecast:
At the start of the week, a sideways trend with a decline toward the support zone is expected. Afterward, sideways drift is likely. A brief decline below support is not excluded. Toward the end of the week, the probability of a reversal and renewed bullish momentum increases.
Potential Reversal Zones Resistance:
Support:
Recommendations:
Bitcoin
Analysis:
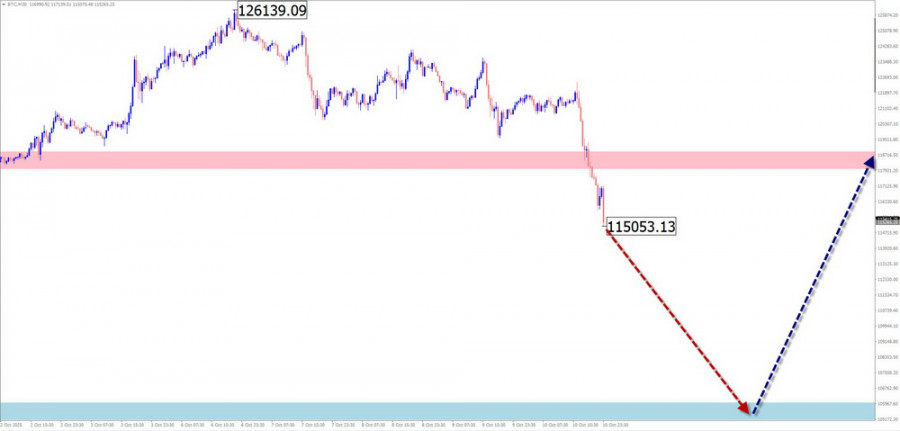
Wave analysis of the bullish trend that has dominated since March shows that the horizontal correction is nearing completion. Its final unfinished segment began on October 6 and forms the last section of the correction. Once completed, the instrument's price is expected to resume its upward trend.
Forecast:
In the next couple of days, Bitcoin's downward movement is expected to continue, reaching the support zone. Prices are likely to consolidate there. Toward the end of the week, renewed growth is anticipated.
Potential Reversal Zones Resistance:
Support:
Recommendations:
Gold
Analysis:
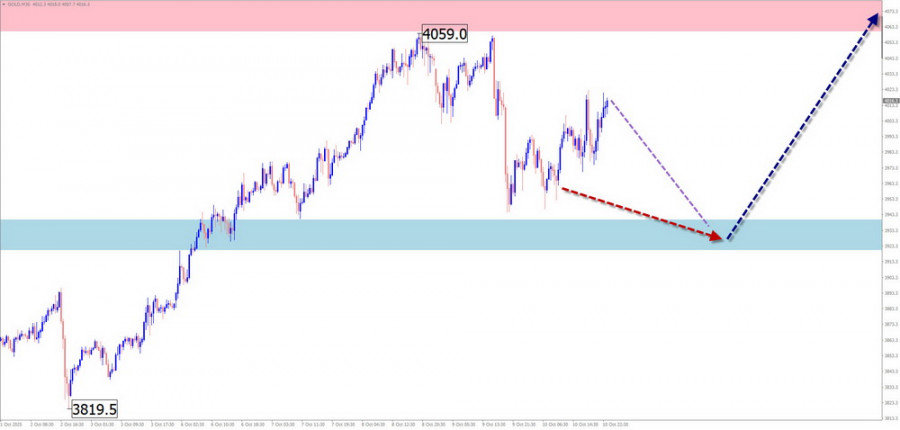
Since May, gold has been forming the final unfinished section of its global bullish trend. After breaking another record high, prices encountered multiple overlapping potential reversal levels of varying scales. In recent days, the price has mostly moved sideways. Analysis shows the structure remains incomplete.
Forecast:
During the upcoming week, the overall sideways trend is expected to continue. Early in the week, a possible decline toward the support zone is likely. Afterward, a reversal and renewed upward movement are expected, possibly reaching the resistance zone.
Potential Reversal Zones Resistance:
Support:
Recommendations:
Notes: In simplified wave analysis (SWA), all waves consist of three parts (A–B–C). On each timeframe, the last incomplete wave is analyzed. Dotted lines indicate expected movements.
Attention: The wave algorithm does not account for the time duration of price movements.

LINKS RÁPIDOS
ForexMart is authorized and regulated in various jurisdictions.
(Reg No.23071, IBC 2015) with a registered office at First Floor, SVG Teachers Co-operative Credit Union Limited Uptown Building, Corner of James and Middle Street, Kingstown, Saint Vincent and the Grenadines
Restricted Regions: the United States of America, North Korea, Sudan, Syria and some other regions.


 Contate-nos

