Ropa smazala předchozí pokles poté, co íránský nejvyšší vůdce vyjádřil skepsi ohledně rozhovorů s USA.
Cena ropy Brent krátce vyskočila na 66 dolarů, ale pak zisky smazala a obchodování se příliš nezměnilo.
Ajatolláh Alí Chameneí v projevu uvedl, že jeho země neví, jak dopadnou rozhovory s USA o jaderné dohodě, ale že si nemyslí, že přinesou výsledek.
Ceny ropy se minulý týden prudce změnily v důsledku řady titulků týkajících se rozhovorů s USA zaměřených na íránský jaderný program. Teherán prohlásil, že jeho schopnost obohacovat uran je „absolutně neoddiskutovatelná“, což je klíčový požadavek USA. Jaderná dohoda by mohla otevřít cestu ke zmírnění sankcí, včetně sankcí na vývoz ropy.
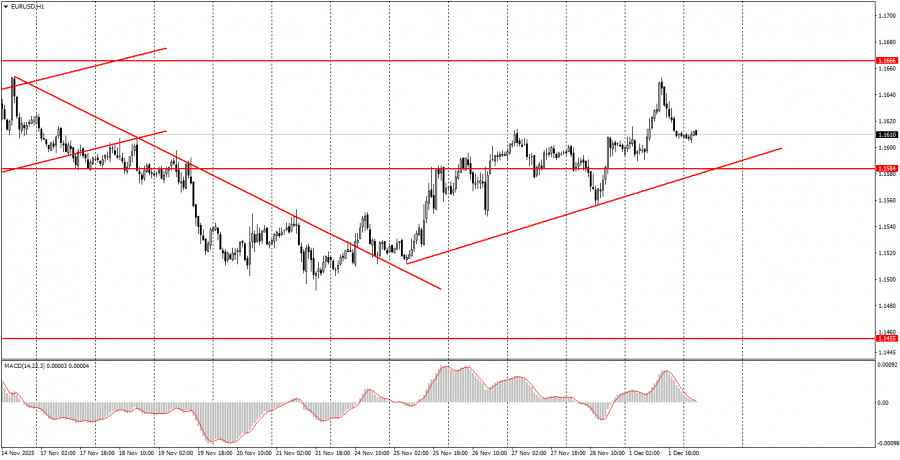
The EUR/USD currency pair maintained an upward trend on Monday and even showed quite decent movements throughout the day. These movements were not straightforward to understand, as the rise began in the first half of the day and was followed by a significant decline. The most important event of the day was the ISM manufacturing activity index, published closer to the evening. This index turned out to be worse than expected and should have triggered a decline in the U.S. dollar. However, the dollar was already falling before this index was published, and afterward it rose. This is where the illogicality lies. We assume that certain large market participants received information about the ISM index ahead of its official publication. This explains the dollar's decline in the first half of the day. Then, profit-taking began, which is why the weak ISM report actually triggered a rise in the dollar. The upward trend remains as long as the price stays above the trend line. However, a flat continues on the daily timeframe.
On the hourly timeframe, the EUR/USD pair has begun another attempt at rising. The overall fundamental and macroeconomic background remains very weak for the U.S. dollar, so the pair may still show declines only on technical grounds—the flat on the daily timeframe remains relevant. However, we expect it to conclude and for the upward trend of 2025 to resume. Market volatility remains low.
On Tuesday, novice traders can again trade from the area of 1.1571-1.1584. A bounce from this area will allow for new long positions with a target of 1.1655-1.1666. A consolidation below this area indicates short positions with targets at 1.1527-1.1531.
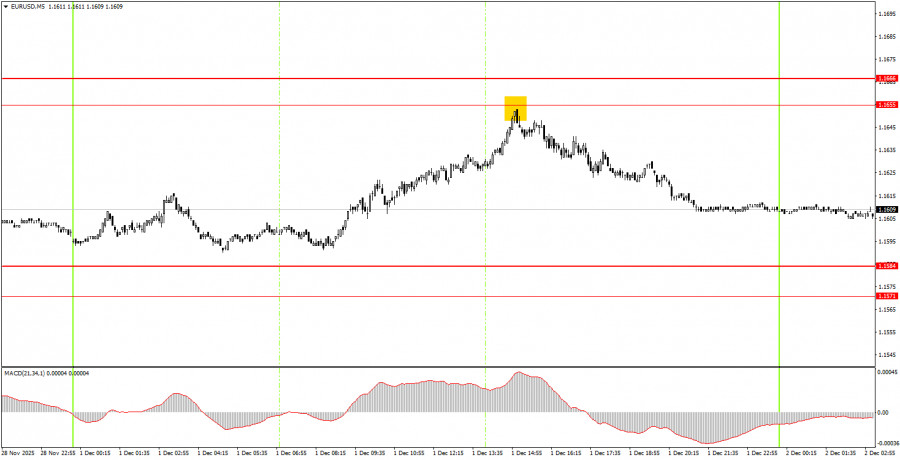
On the 5-minute timeframe, levels to consider include 1.1354-1.1363, 1.1413, 1.1455-1.1474, 1.1527-1.1531, 1.1571-1.1584, 1.1655-1.1666, 1.1745-1.1754, 1.1808, 1.1851, 1.1908, 1.1970-1.1988. Two macroeconomic reports are scheduled for Tuesday, both in the Eurozone. We will see the November inflation figure in the first estimate (the most important), as well as the unemployment rate. We've previously noted that inflation does not significantly impact trader sentiment at this time, but it remains an important indicator for traders.
Important Note: Significant speeches and reports (always included in the news calendar) can greatly influence the movement of the currency pair. Therefore, during their release, it is advisable to trade cautiously or exit the market to avoid sharp reversals against the preceding movement.
Remember: For beginners trading in the Forex market, it is important to understand that not every trade can be profitable. Developing a clear strategy and practicing money management are keys to long-term trading success.

LINKS RÁPIDOS
ForexMart is authorized and regulated in various jurisdictions.
(Reg No.23071, IBC 2015) with a registered office at First Floor, SVG Teachers Co-operative Credit Union Limited Uptown Building, Corner of James and Middle Street, Kingstown, Saint Vincent and the Grenadines
Restricted Regions: the United States of America, North Korea, Sudan, Syria and some other regions.


 Contate-nos

