Akcie německých výrobců automobilů v pondělí v ranním frankfurtském obchodování zaznamenaly prudký růst v návaznosti na rozhodnutí amerického prezidenta Donalda Trumpa odložit hrozbu uvalení 50 % cel na dovoz z Evropské unie.
Akcie Mercedes Benz Group AG zaznamenaly nárůst nad 2 %, Bayerische Motoren Werke AG rovněž zaznamenaly více než 2% posílení a Volkswagen AG si polepšil o 2,4 %.
V pátek Trump pohrozil zavedením 50 % cla na zboží dovážené z EU, což způsobilo propad evropských trhů a vymazání zisků.
V pondělí akcie změnily kurz po Trumpově rozhodnutí cla odložit.
The EUR/USD currency pair traded rather weakly, with a downward bias, on Friday. Last week, the pair closed below the ascending trendline, below the Ichimoku indicator lines, and at the same time failed to overcome the 1.1800–1.1830 area, which serves as the upper boundary of the sideways channel on the daily timeframe. Thus, the pair's decline is quite natural on technical grounds. However, we do not yet believe in a prolonged fall of the pair. Many important reports will be published in the U.S. this week, and traders still need to understand how the dollar will react to America's military aggression against Venezuela and the capture of its president. Recall that a fall in the pair means a rise in the U.S. dollar, and it is currently extremely difficult for us to imagine on what basis it could rise this week.
From a technical standpoint, the American currency can indeed appreciate, since exiting the 1.1400–1.1830 sideways channel again failed, and the local trend has turned bearish. Because the flat persists, the dollar can rise under any fundamental and macroeconomic background. Although, of course, if data from across the ocean again prove weak, the downward correction may remain a correction and not turn into a trend.
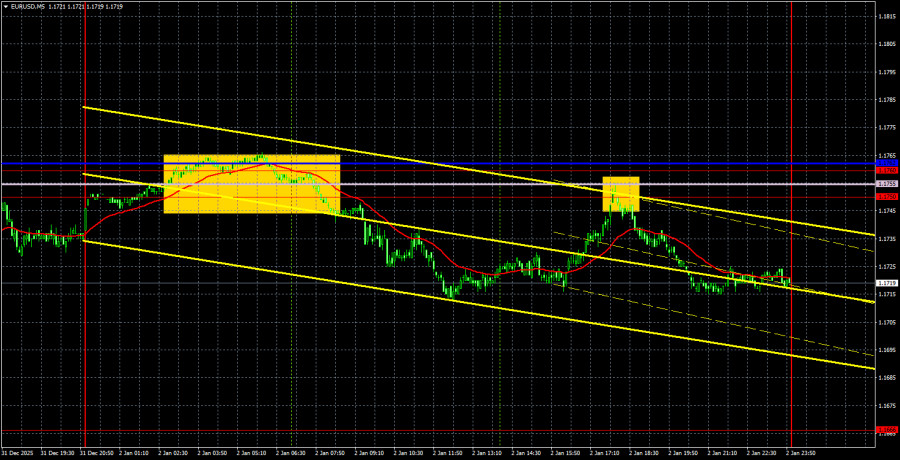
On the 5-minute timeframe two trade signals were formed on Friday that traders could have worked on, remembering the low volatility. The price twice rebounded from the 1.1750–1.1762 area; in both cases the move south was about 25 pips. We understand this is small, but we cannot influence the strength of market moves, and we have been writing about low volatility for several months in a row. Traders must therefore be aware of this when opening any positions.
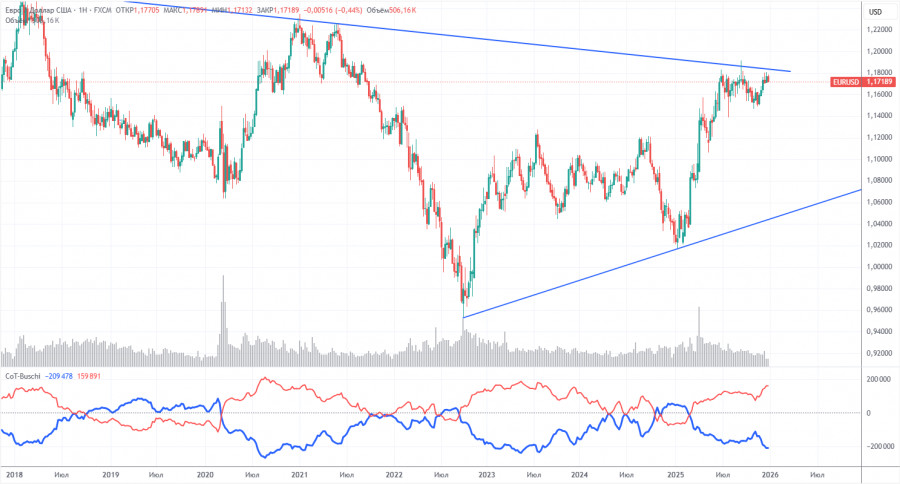
The latest COT report is dated December 23. The illustration above clearly shows that the net position of non-commercial traders was bullish for a long time; bears barely moved into dominance at the end of 2024 but very quickly lost it. Since Trump took office for a second time as U.S. president, only the dollar has been falling. We cannot say that the decline of the American currency will continue with 100% probability, but current global developments suggest that scenario. The red and blue lines are moving apart from each other, which indicates the bulls' overwhelming dominance.
We still do not see any fundamental factors for the strengthening of the euro, while there remain sufficient factors for the decline of the American currency. The global downtrend persists, but what does it mean now, given that the price has moved over the past 17 years? Over the last three years only the euro has been rising, and that is a trend too.
The arrangement of the red and blue indicator lines continues to signal the preservation and strengthening of the bullish trend. During the last reporting week, the number of longs in the Non-commercial group increased by 16,200, and the number of shorts by 1,200. Accordingly, the net position for the week grew by another 15,000 contracts.
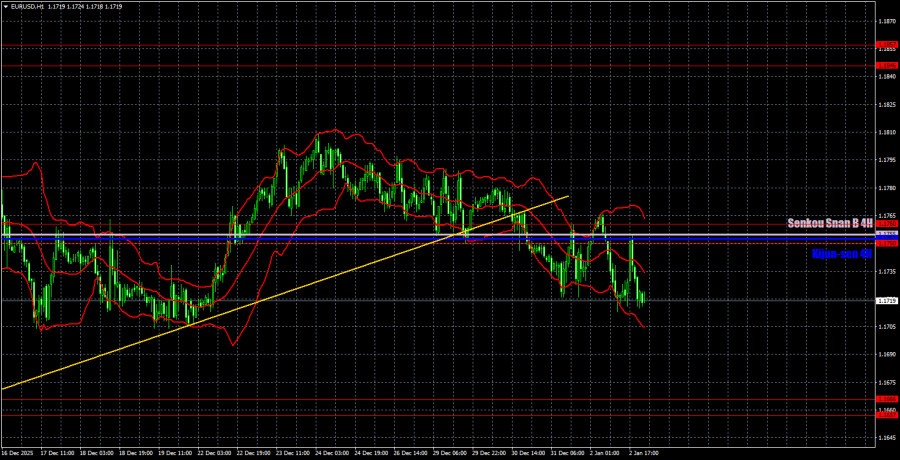
On the hourly timeframe, EUR/USD changed its trend to bearish. Effectively, the upper line of the 1.1400–1.1830 sideways channel was tested twice, and the price failed to leave this channel. This week, the market has to "digest" a lot of important information, so the movement can be anything. We, of course, support another rise of the euro, and the COT reports continue to signal that market-makers are accumulating long positions in the euro.
For January 5, we highlight the following levels for trading: 1.1234, 1.1274, 1.1362, 1.1426, 1.1542, 1.1604–1.1615, 1.1657–1.1666, 1.1750–1.1760, 1.1846–1.1857, 1.1922, 1.1971–1.1988, as well as the Senkou Span B (1.1755) and Kijun-sen (1.1752) lines. Ichimoku indicator lines may shift during the day, which should be taken into account when determining trading signals. Do not forget to move the stop loss to breakeven if the price has moved 15 pips in the correct direction. This will protect against possible losses if the signal turns out to be false.
No important events or releases are scheduled in the Eurozone on Monday, but the first important U.S. report this week — the ISM manufacturing index — will be released. Remembering the events in Venezuela, we may face a relatively volatile day.
On Monday, traders can trade from the 1.1750–1.1760 area. A price rebound from it to the downside would make short positions relevant, with a target zone of 1.1657–1.1666. A close above it would allow opening longs with a target of 1.1810–1.1830.
Price support and resistance levels (resistance/support) — thick red lines near which movement may end. They are not sources of trading signals.
Kijun-sen and Senkou Span B lines — Ichimoku indicator lines transferred to the hourly timeframe from the 4-hour. They are strong lines.
Extremum levels — thin red lines from which the price previously bounced. They are sources of trading signals.
Yellow lines — trend lines, trend channels and any other technical patterns.
Indicator 1 on the COT charts — the size of the net position of each trader category.

LINKS RÁPIDOS
ForexMart is authorized and regulated in various jurisdictions.
(Reg No.23071, IBC 2015) with a registered office at First Floor, SVG Teachers Co-operative Credit Union Limited Uptown Building, Corner of James and Middle Street, Kingstown, Saint Vincent and the Grenadines
Restricted Regions: the United States of America, North Korea, Sudan, Syria and some other regions.


 Contate-nos

