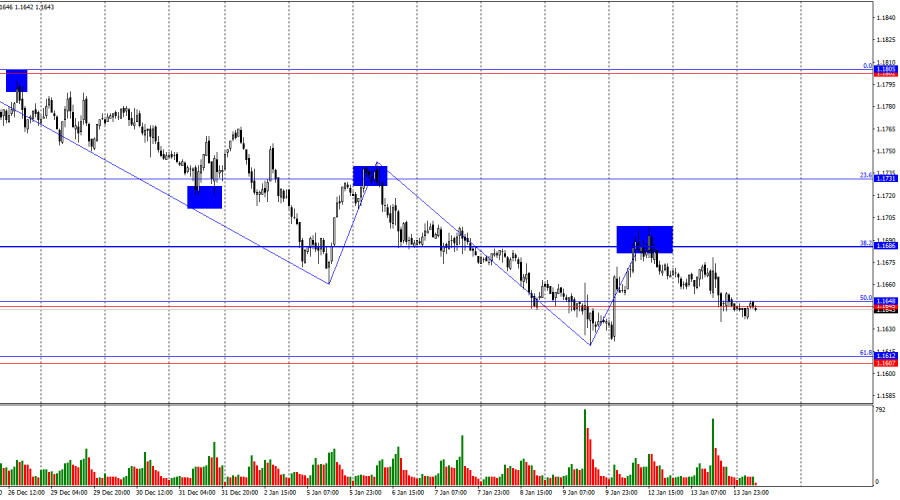
The EUR/USD pair continued its weak downward movement on Tuesday after rebounding from the 38.2% corrective level at 1.1686. A consolidation below the support level of 1.1645–1.1648 allows traders to expect a further decline toward the next support level at 1.1607–1.1612. A daily close above 1.1645–1.1648 would favor the European currency and some growth toward the corrective levels at 1.1686 and 1.1731.
The wave situation on the hourly chart remains simple. The last completed upward wave failed to break the previous wave's peak, while the latest downward wave broke the previous low. Thus, the trend remains bearish. In my view, the pair's decline will not be long-lasting or strong, but a break of the current bearish trend is now needed in order to expect a bullish advance. Based on the current chart pattern, such a break would occur above the 1.1700 level.
On Tuesday, bearish traders continued to apply pressure. Their daily attacks can hardly be called attacks in the literal sense, as the dollar is rising at a very slow pace—but almost every day. Yesterday, traders reacted to a neutral U.S. inflation report. According to this report, the headline indicator remained at 2.7% y/y, while core inflation stayed at 2.6% y/y. Thus, no changes were recorded, but the lack of change currently supports the bears. If inflation does not continue to decline, the Fed has fewer reasons for further monetary easing. This is certainly a controversial conclusion, which is why traders' reaction was very weak. However, I would note that this week Donald Trump has already announced new trade tariffs for all countries trading with Iran and is also preparing an attack on Iran itself in support of protesters. There was even more news last week, yet trading activity remains very low. Against the backdrop of other events, the market reaction to Tuesday's inflation report can still be considered relatively convincing.
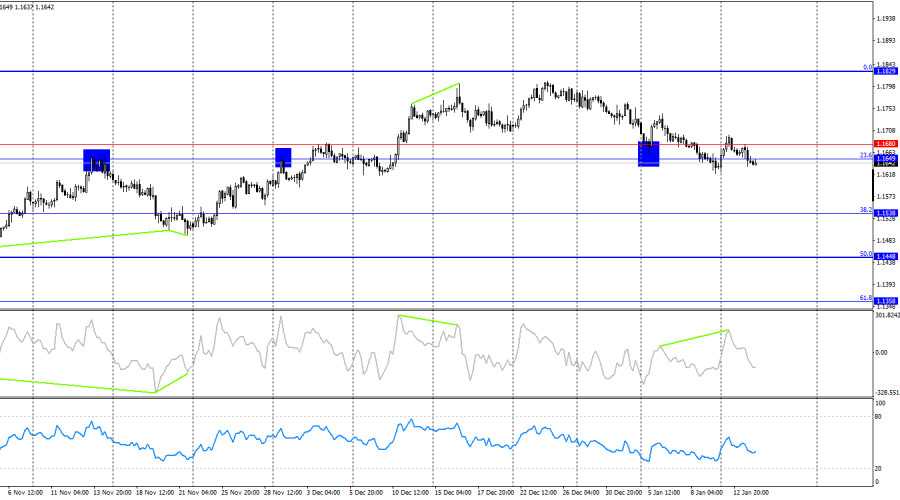
On the 4-hour chart, the pair has returned to the support level of 1.1649–1.1680. Another rebound from this zone would favor the EU currency and some growth toward the 0.0% corrective level at 1.1829. A consolidation below the 1.1649–1.1680 support level would increase the chances of a continued decline toward the next Fibonacci level at 38.2% – 1.1538. A bearish divergence has formed on the CCI indicator, which allows for expectations of another decline.
Commitments of Traders (COT) Report:
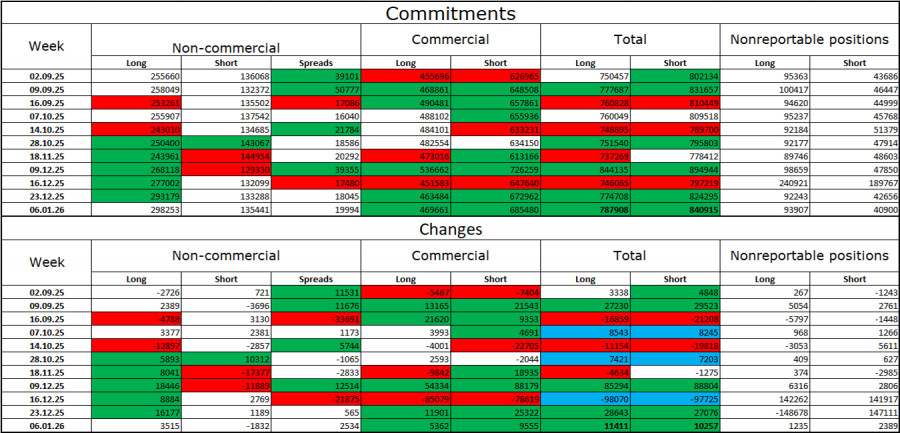
During the latest reporting week, professional traders opened 3,515 long positions and closed 1,832 short positions. Sentiment among the "Non-commercial" group remains bullish thanks to Donald Trump and his policies, and continues to strengthen over time. The total number of long positions held by speculators now stands at 298,000, while short positions amount to 135,000—more than a twofold advantage for the bulls.
For thirty-three consecutive weeks, large players were reducing short positions and increasing long ones. Then the government shutdown began, and now we see the same picture again: professional traders continue to build long positions. Donald Trump's policies remain the most significant factor for traders, as they create numerous problems that will have long-term and structural consequences for the United States—for example, the deterioration of the labor market. Traders fear a loss of the Fed's independence in 2026 under pressure from Trump and amid the resignation of Jerome Powell.
News calendar for the U.S. and the Eurozone:
On January 13, the economic calendar contains three entries, none of which can be considered important. The impact of the news background on market sentiment on Wednesday will be weak and limited to the second half of the day.
EUR/USD forecast and trading advice:
Selling the pair was possible after a rebound from the 1.1686 level on the hourly chart, with targets at 1.1648 and 1.1612. These positions can be kept open today. Buying opportunities may arise today either on a rebound from the 1.1607–1.1612 level on the hourly chart or after a close above 1.1645–1.1648, with targets at 1.1686 and 1.1731.
Fibonacci grids are drawn from 1.1492–1.1805 on the hourly chart and from 1.1066–1.1829 on the 4-hour chart.

LINKS RÁPIDOS
ForexMart is authorized and regulated in various jurisdictions.
(Reg No.23071, IBC 2015) with a registered office at First Floor, SVG Teachers Co-operative Credit Union Limited Uptown Building, Corner of James and Middle Street, Kingstown, Saint Vincent and the Grenadines
Restricted Regions: the United States of America, North Korea, Sudan, Syria and some other regions.


 Contate-nos

