Confirmation of this double-bottom pattern would only be observed if the price consolidates and remains above $87.50; in that case, we could expect the upward movement to continue toward $91
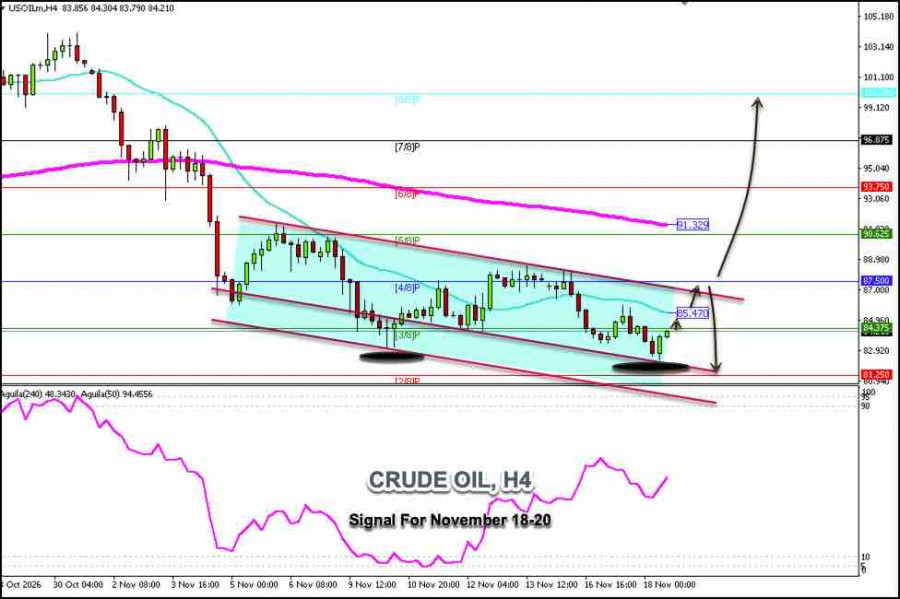
Crude oil is trading around $84.21, rebounding after hitting a low of $82.29 during the European session; from here, we expect the price to continue rising until it reaches the 21-day simple moving average (SMA), which stands at around $85.47.
Since early November, crude oil has been under downward pressure, and we observe the formation of a downtrend channel on the H4 chart.
Therefore, if the price remains above $84.37, it could be considered an opportunity to open long positions in anticipation of it reaching Murray 4/8 or the upper band of the downtrend channel, around $87.50.
In the coming hours, we expect crude oil to consolidate. From a technical perspective, if the price remains above its weekly low, it could be interpreted as the formation of a double-bottom pattern—as it could coincide with the price zone seen on November 9—and this, in turn, could signal a recovery in crude oil prices in the coming days.
Confirmation of this double-bottom pattern would only be observed if the price consolidates and remains above $87.50; in that case, we could expect the upward movement to continue toward $91 and $93.75—around the Murray 6/8 level—and ultimately reach the psychological level of $100.
Furthermore, it is worth noting that crude oil has left a gap around $102. From a technical viewpoint, if the price returns above the 200-period exponential moving average (EMA), it could be expected to reach those levels.
On the other hand, if the price reaches the upper band of the bearish channel and fails to break above this zone, it could be considered an opportunity to sell below $87.50, with targets at the Murray 2/8 level, around $81.25.

QUICK LINKS
ForexMart is authorized and regulated in various jurisdictions.
(Reg No.23071, IBC 2015) with a registered office at First Floor, SVG Teachers Co-operative Credit Union Limited Uptown Building, Corner of James and Middle Street, Kingstown, Saint Vincent and the Grenadines
Restricted Regions: the United States of America, North Korea, Sudan, Syria and some other regions.







 Contact Us