The GBP/USD pair also continued moving north on Wednesday, although there were no local reasons for this. Nevertheless, the British pound keeps rising for the same reasons as the euro — demand for the dollar is steadily declining. We have discussed the global drivers many times, and nothing has changed over time. The pound is currently climbing quietly and steadily. The movement is measured, and as practice shows, at this pace, the price could rise almost every day. Therefore, even today, we may see another upward move. However, today the price could be influenced at least by UK reports, which will be released in about an hour and a half. Any pullback at this stage is a reason to open long positions (provided there are buy signals). If UK data turns out positive, long positions will be even more relevant.
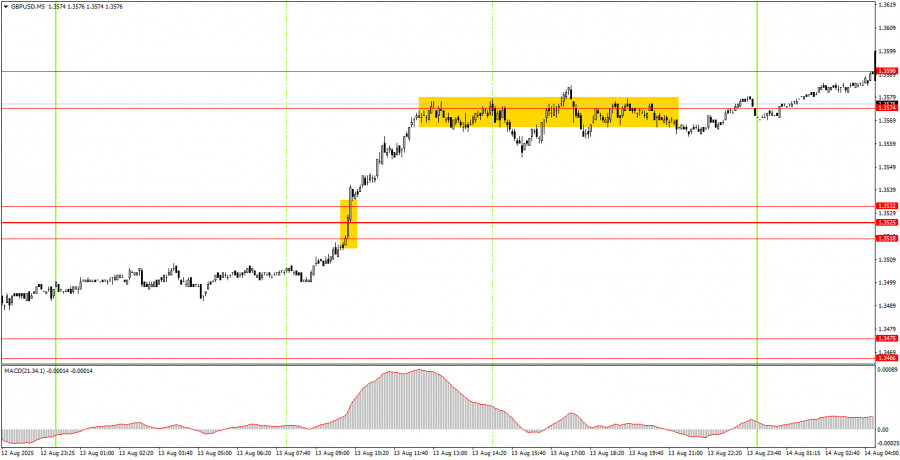
On the 5-minute timeframe on Wednesday, one excellent buy signal was formed. During the European trading session, the price broke through the 1.3518–1.3532 area, then managed to reach the 1.3574–1.3590 area, where it traded for the rest of the day. Thus, novice traders could have opened long positions in the morning and taken profit just a couple of hours later.
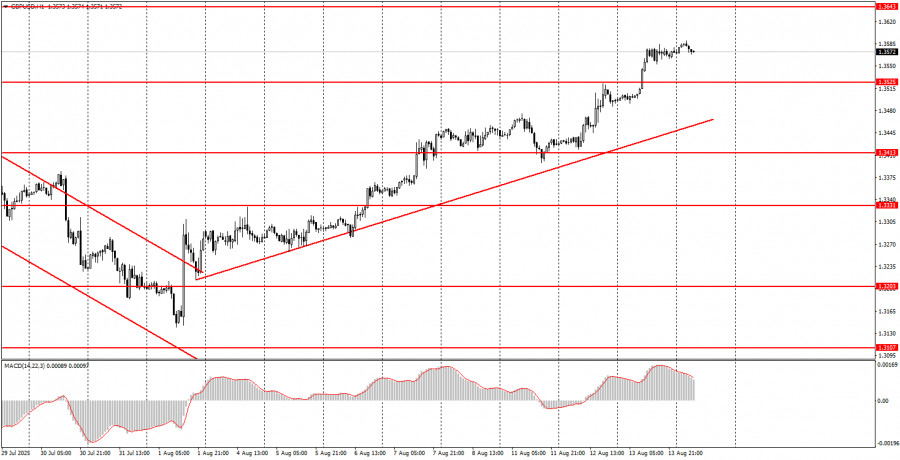
On the hourly timeframe, the GBP/USD pair indicates that the downtrend has ended. Given the events of the last two weeks, we would not bet a penny on the growth of the US currency. The dollar continues to fall steadily and consistently. The new ascending trendline supports the bulls, and grounds for expecting a decline in the pair will only appear if the price consolidates below it.
On Thursday, the GBP/USD pair may take a short pause but could also continue its calm upward movement. Thus, breaking above the 1.3574–1.3590 area will be a good reason to open new long positions with a target at 1.3643–1.3652. A bounce from this area could allow for short positions with a target at 1.3518–1.3532.
On the 5-minute timeframe, trading can now be based on the levels: 1.3102–1.3107, 1.3203–1.3211, 1.3259, 1.3329–1.3331, 1.3413–1.3421, 1.3466–1.3475, 1.3518–1.3532, 1.3574–1.3590, 1.3643–1.3652, 1.3682, 1.3763. On Thursday, the UK is scheduled to release Q2 GDP and industrial production reports. In our view, these are important data that could provoke a strong market reaction. US reports are much less significant, and the reaction to them will likely be negligible.
Support and Resistance Levels: These are target levels for opening or closing positions and can also serve as points for placing Take Profit orders.
Red Lines: Channels or trendlines indicating the current trend and the preferred direction for trading.
MACD Indicator (14,22,3): A histogram and signal line used as a supplementary source of trading signals.
Important Events and Reports: Found in the economic calendar, these can heavily influence price movements. Exercise caution or exit the market during their release to avoid sharp reversals.
Forex trading beginners should remember that not every trade will be profitable. Developing a clear strategy and practicing proper money management are essential for long-term trading success.

QUICK LINKS
ForexMart is authorized and regulated in various jurisdictions.
(Reg No.23071, IBC 2015) with a registered office at First Floor, SVG Teachers Co-operative Credit Union Limited Uptown Building, Corner of James and Middle Street, Kingstown, Saint Vincent and the Grenadines
Restricted Regions: the United States of America, North Korea, Sudan, Syria and some other regions.


 Contact Us

