The EUR/USD currency pair spent most of Monday in decline, which could only have been triggered by the capture of Nicolas Maduro. In our view, this was not a reason to buy the US dollar, as there was no actual geopolitical conflict, and the US dollar has not been able to fully qualify as a "safe-haven currency" for a whole year now. Nevertheless, the market bought some dollars as a formality. Closer to the evening, however, it began to actively get rid of them.
Later in the day, a truly important report on US manufacturing business activity (ISM) was released. Once again, it was disappointing. The index stood at 47.9 points in December, showing a reading lower than in November and below forecasts. Thus, the dollar's collapse in the second half of the day was entirely natural, and the events in Venezuela can be considered fully priced in.
From a technical point of view, the upward trend may resume at any moment. The pair remains within the sideways channel of 1.1400–1.1830, but recently it has been trading closer to the upper boundary. The local trend is downward, but a breakout above the Senkou Span B and Kijun-sen lines would bring buyers back to the market for another attempt to exit the sideways channel through its upper boundary. This week, the macroeconomic background will be important for the dollar, and the very first report showed that positive figures are probably not worth expecting.
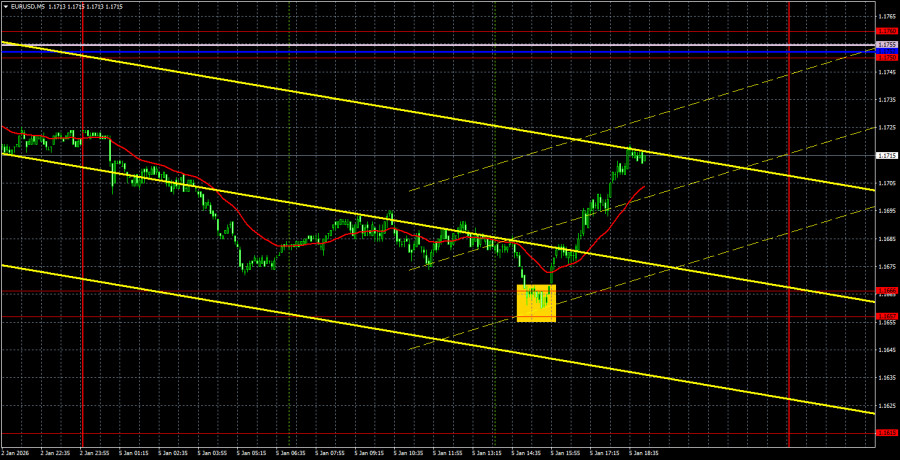
On the 5-minute timeframe, one trading signal was formed yesterday. The price bounced off the 1.1657–1.1666 level, which allowed traders to open long positions with a target in the 1.1750–1.1760 level. The pair's growth may continue today.
COT Report
The latest COT report is dated December 23. The illustration above clearly shows that the net position of non-commercial traders had been "bullish" for a long time. Bears managed to move into their own dominance zone at the end of 2024, but lost it very quickly. Since Trump took office as US president for the second time, only the dollar has been falling. We cannot say with 100% certainty that the decline of the US currency will continue, but current global developments hint precisely at this scenario. The red and blue lines are moving away from each other, which indicates a very strong dominance of the bulls.
We still do not see any fundamental factors for strengthening the European currency, but there remains a sufficient number of factors for the decline of the American one. The global downward trend is still in place, but what significance does it now have where the price moved over the past 17 years? Over the past three years, only the European currency has been growing, and this is also a trend.
The position of the red and blue lines of the indicator continues to point to the preservation and strengthening of the bullish trend. During the last reporting week, the number of long positions held by the "Non-commercial" group increased by 16.2 thousand, while the number of short positions increased by 1.2 thousand. Accordingly, the net position rose by another 15.0 thousand contracts over the week.
EUR/USD 1H Analysis
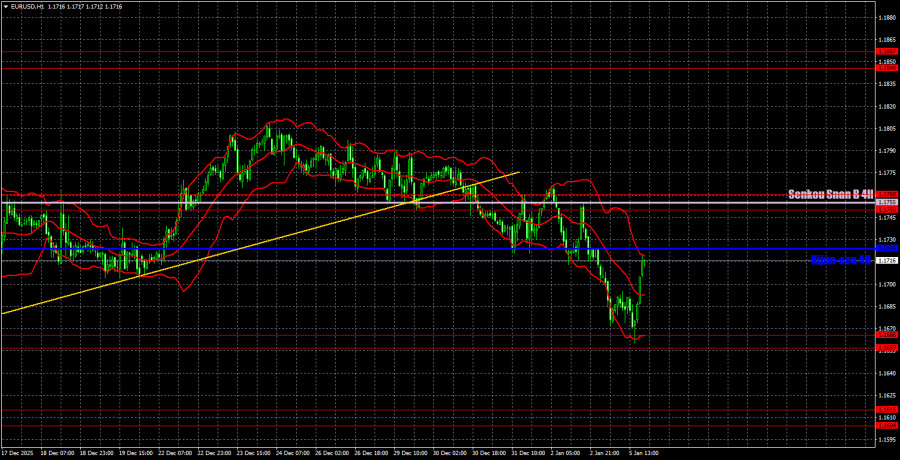
On the hourly timeframe, the EUR/USD pair has shifted to a downward trend. In fact, the upper boundary of the 1.1400–1.1830 sideways channel was tested twice, and the price failed to leave this channel. This week, the market will have to "digest" a lot of important information, so price movement may go in any direction. We, of course, support renewed growth of the European currency, and COT reports continue to signal an increase in long euro positions by market makers.
For January 6, we highlight the following trading levels: 1.1234, 1.1274, 1.1362, 1.1426, 1.1542, 1.1604–1.1615, 1.1657–1.1666, 1.1750–1.1760, 1.1846–1.1857, 1.1922, 1.1971–1.1988, as well as the Senkou Span B (1.1755) and Kijun-sen (1.1724) lines.
The Ichimoku indicator lines may move during the day, which should be taken into account when identifying trading signals. Do not forget to move the Stop Loss order to breakeven if the price moves 15 points in the correct direction. This will protect against potential losses if the signal turns out to be false.
On Tuesday, the European Union is scheduled to release second estimates of December business activity reports in the services and manufacturing sectors. These reports are frankly secondary and do not attract much interest. Attention may be paid only to the December inflation report in Germany. There will also be no interesting publications in the United States.
Trading Recommendations
On Tuesday, traders may trade from the Kijun-sen line or the 1.1750–1.1760 level. Bounces from these resistance levels will allow opening new short positions with nearby targets, while a breakout will open the way for long positions under a similar scenario.
Explanations to the Illustrations

QUICK LINKS
ForexMart is authorized and regulated in various jurisdictions.
(Reg No.23071, IBC 2015) with a registered office at First Floor, SVG Teachers Co-operative Credit Union Limited Uptown Building, Corner of James and Middle Street, Kingstown, Saint Vincent and the Grenadines
Restricted Regions: the United States of America, North Korea, Sudan, Syria and some other regions.


 Contact Us

