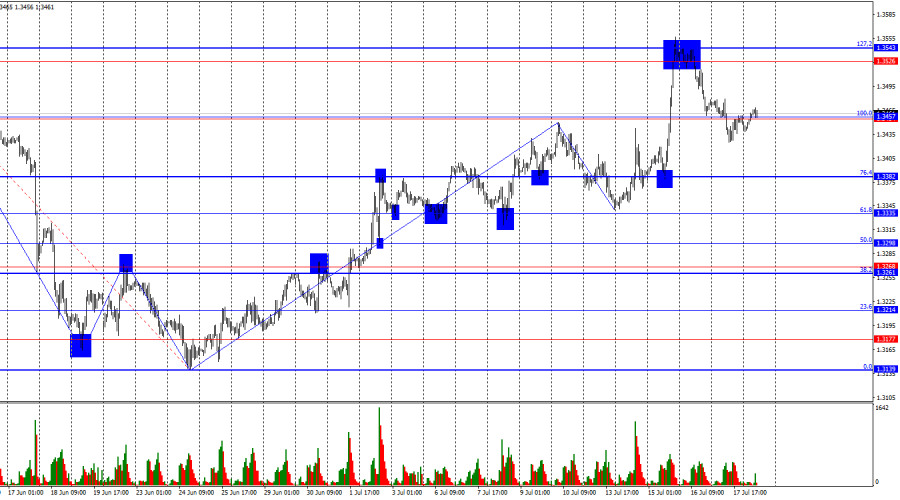
On the hourly chart, GBP/USD reversed in favor of the pound on Friday and closed above the resistance zone at 1.3454–1.3457. That leaves room for the advance to continue toward the resistance area of 1.3526–1.3543. A close below the 1.3454–1.3457 zone will favor the dollar and signal a resumption of the decline toward the 76.4% correction level at 1.3382.
The wave picture remains bullish. The last completed downward wave did not break the prior low, while the new upward wave exceeded the previous high. Thus, bulls continue their advance. In my view, the 2026 bearish impulse is complete; only geopolitics may prevent bulls from pressing on. Even then, geopolitical developments are likely to produce only a corrective pullback.
The information flow on Friday was rather weak, yet the pound held up, unlike the euro, and continued to perform strongly. Despite no signs from the Bank of England of imminent policy tightening, the pound remains in demand, which I find logical. It is unclear why the euro cannot display similar strength, but the market is the arbiter. The Middle East conflict is again intensifying: The United States and Iran have been striking one another daily for more than a week. Talks are not merely paused this time; they have effectively stopped. Donald Trump is reportedly considering a broader range of strikes on Iran and is redeploying new military forces to the Middle East. All this suggests the conflict is likely to expand rather than end soon. Oil is rising again almost every day, so the situation is reverting to familiar patterns. Why is the dollar not rising? Because the market largely priced that factor in during the spring. I note that although the euro is not showing positive momentum, it is also not falling rapidly, which suggests the market is not fearful of a prolonged US–Iran war.
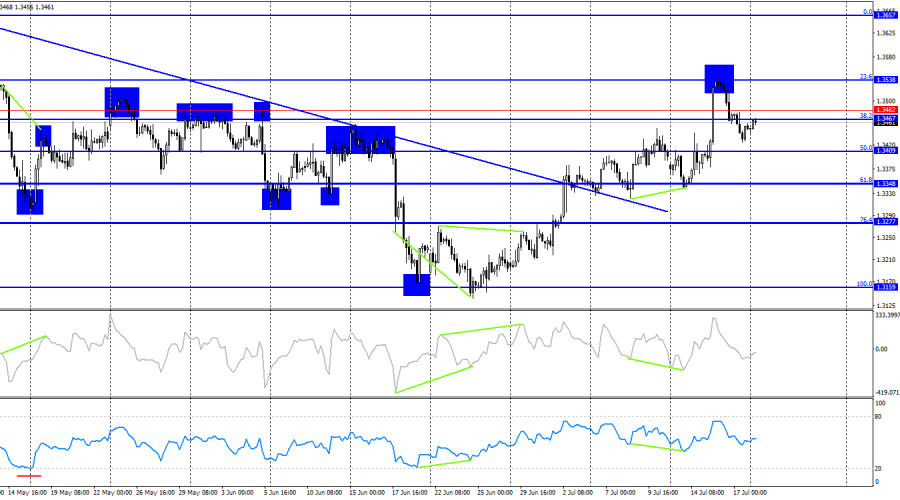
On the 4-hour chart, GBP/USD bounced off the 23.6% correction level of 1.3538, reversed in favor of the greenback and closed below the 1.3467–1.3482 zone. That leaves room for a deeper decline toward the 50.0% Fibonacci level of 1.3409. A close back above 1.3467–1.3482 will reopen the path for a further rise in the pound. No divergence is apparent today.
Commitments of Traders (COT) report:
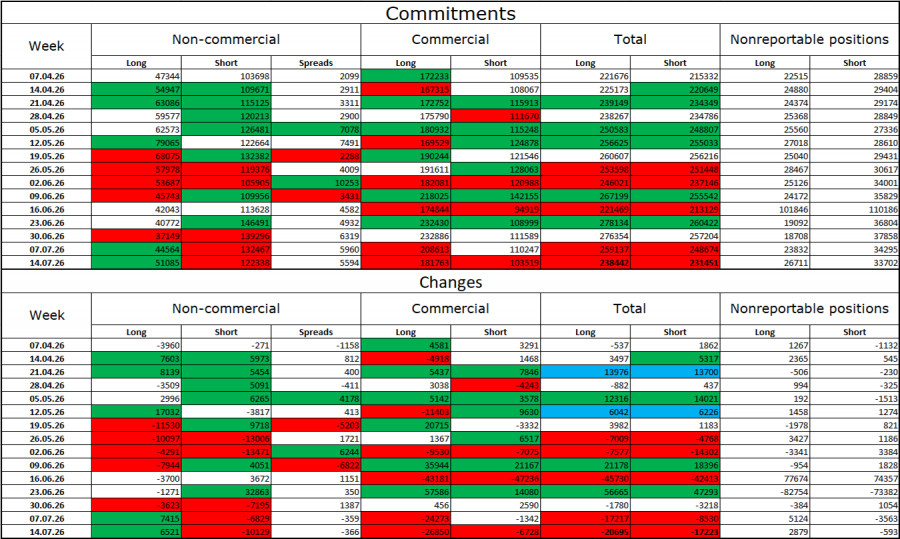
The non-commercial category's positioning became less bearish over the last reporting week but remains bearish. Long contracts held by speculators rose by 6,521, while short contracts fell by 10,129. The gap between long and short positions now stands at about 51,000 versus 122,000. Bears have dominated in recent months. However, given the changed information backdrop, this dominance now raises questions.
I still do not believe in a sustained bearish trend for the pound, but in the near term, developments will depend less on economic indicators, Trump's trade policy, or central bank action and more on the duration, scale, and consequences of the Middle East war. In recent weeks, the market had repositioned for peace, but US-Iran talks collapsed before they really began. It is not certain they will resume soon.
Macroeconomic calendar for the US and the UK:
On July 20, the economic calendar contains no items of interest. Economic news will not influence market sentiment on Monday.
GBP/USD outlook and trader guidance:
Sells were possible on a rejection from the 1.3526–1.3543 zone on the hourly chart with a target at 1.3454–1.3457. That target has been reached. New sell orders are appropriate on a close below 1.3454–1.3457 with a target of 1.3382. Buys are appropriate on a close above 1.3454–1.3457 with a target of 1.3526–1.3543.
Fibonacci level grids were built from 1.3457–1.3139 on the hourly chart and from 1.3158–1.3655 on the 4-hour chart.
QUICK LINKS
ForexMart is authorized and regulated in various jurisdictions.
(Reg No.23071, IBC 2015) with a registered office at First Floor, SVG Teachers Co-operative Credit Union Limited Uptown Building, Corner of James and Middle Street, Kingstown, Saint Vincent and the Grenadines
Restricted Regions: the United States of America, North Korea, Sudan, Syria and some other regions.









 Contact Us