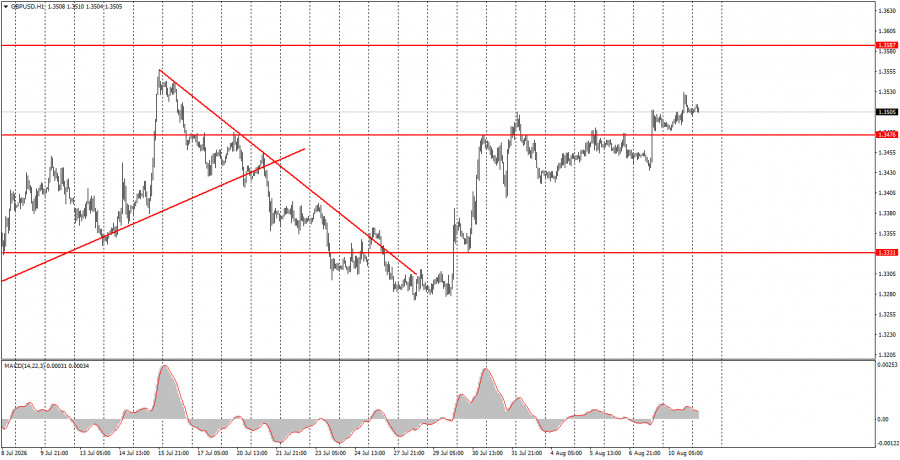
The GBP/USD pair continued its upward movement on Monday, unlike the EUR/USD pair. We believe that the British pound is behaving quite reasonably right now. The US labor market has once again shown weakness, making it nearly impossible for the Federal Reserve to tighten monetary policy to reduce inflation. If it becomes known tomorrow that inflation in the US has slowed for the second consecutive month, then monetary tightening may not be necessary at all. Consequently, the market will have to abandon its "hawkish" expectations. It is already doing this, as there are simply no other options left. Based on this, the pound could continue to rise even in the absence of local supportive factors. The British currency continues to perform well, unlike the euro. On Monday, there were no important events or publications in the UK or the US. Volatility was very weak and is likely to remain so today. The key report of the week—US inflation—will be released tomorrow.
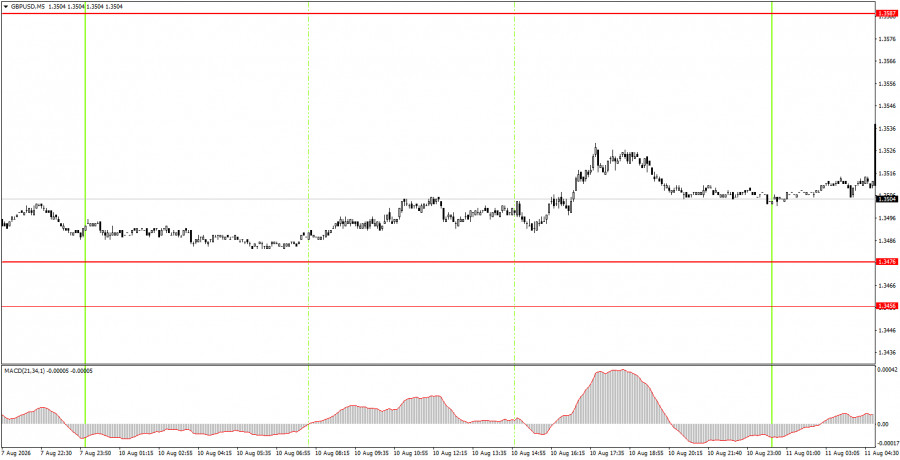
On the 5-minute timeframe on Monday, no trading signals were formed. During the Asian trading session, the pair approached the 1.3456–1.3476 area but was unable to work through it and did not generate a signal. Thus, there were no grounds for opening positions.
On the hourly timeframe, the GBP/USD pair maintains its upward trend. In our view, the pound sterling will continue to rise even if local factors do not support it. On the weekly timeframe, the movement from the lower boundary of the sideways channel to the upper boundary is ongoing. This movement continues. Confidence in a Fed rate hike in September is visibly waning; the market is no longer paying attention to geopolitics, and technical indicators support the British pound's growth.
On Tuesday, novice traders may open short positions if consolidation occurs below the 1.3456–1.3476 area, targeting 1.3380–1.3386. Long positions can be kept open with a target of 1.3587–1.3598.
On the 5-minute timeframe, trading can currently take place at the following levels: 1.3175–1.3180, 1.3259–1.3267, 1.3319–1.3331, 1.3380–1.3386, 1.3456–1.3476, 1.3587–1.3598, 1.3631–1.3641, 1.3695. On Tuesday, there are again no important events scheduled in the US or the UK, so very weak movements may be observed throughout the day.
Support and resistance price levels (areas) are the targets when opening buy or sell orders or sources of signals.
Red lines denote channels or trend lines that reflect the current trend and indicate in which direction trading is currently favored.
The MACD indicator (14,22,3) – histogram and signal line – is a supporting indicator that can also be used as a source of signals.
Important speeches and reports (as listed in the news calendar) can significantly influence the movement of the currency pair. Therefore, during their release, trading should be approached with utmost caution, or one should exit the market to avoid sharp price reversals against the preceding movement.
Beginners in Forex trading should remember that not every trade can be profitable. Developing a clear strategy and proper money management are essential for long-term trading success.

QUICK LINKS
ForexMart is authorized and regulated in various jurisdictions.
(Reg No.23071, IBC 2015) with a registered office at First Floor, SVG Teachers Co-operative Credit Union Limited Uptown Building, Corner of James and Middle Street, Kingstown, Saint Vincent and the Grenadines
Restricted Regions: the United States of America, North Korea, Sudan, Syria and some other regions.










 Contact Us