The GBP/USD currency pair continued to trade sideways on Thursday, as was particularly visible on the hourly chart. The British pound demonstrates the market's weariness when new geopolitical news comes in. Traders are tired of Trump's endless promises, the recurring opening and closing of the Strait of Hormuz, and constant reports of deals and negotiations. Therefore, the market is now only prepared to respond to significant, verified, and confirmed information. What's the point of another message from the U.S. president if it is contradicted by the authorities in Tehran just 15 minutes later? This week, Trump has mentioned negotiations and a deal happening "any minute now" at least five times. Yet all we see is that Tehran is refusing to meet again with JD Vance and other "cronies" of Trump, as the White House has a peculiar understanding of the concepts of "agreement" and "fairness."
Over the past weekend, Trump claimed that the Strait of Hormuz is fully open and secure, only for Iran to close it again on Saturday. It turned out that Tehran agreed to open the strait, but the White House maintained its blockade. This has created a situation where all commercial vessels and tankers can cross the strait at will while the U.S. Navy continues to block Iranian ports and ships. Naturally, Iran could not tolerate such a situation in its "own" strait for more than a day.
Yesterday, Donald Trump made several more "important" statements. First, the U.S. president indicated that there are no timelines for the war in Iran. It does not matter that, a month and a half ago, Trump spoke about the short duration of the operation and said it would take no more than a few weeks. The seventh week of confrontation has passed, and the market has once again confirmed that Trump's words should be viewed with skepticism. Trump also stated that negotiations could last as long as needed, and that the US is profiting directly from the ongoing conflict.
This is indeed the case, as oil and gas prices (which Washington actively trades) have surged over the past two months, and currently, there are no military actions in the Middle East. Thus, American energy companies are reaping significant profits (while ensuring they share with the government), and at the moment, Trump is spending minimally on the war in the Middle East. Here he is—a true businessman.
Overall, Trump has nearly stated openly that he has decided to impose a financial blockade on Iran. Iran, for which revenues from energy sales are fundamental to its budget, is supposed by Trump's thinking to rush to a deal if the Strait of Hormuz is completely closed to it. Meanwhile, the US would make more money on LNG and oil. This is how one can kill two birds with one stone. Should we expect further declines in the GBP/USD pair? It is possible, but unlikely to be strong or prolonged. The geopolitical factor has already been priced in by traders, just like the most pessimistic scenario regarding oil and gas prices.
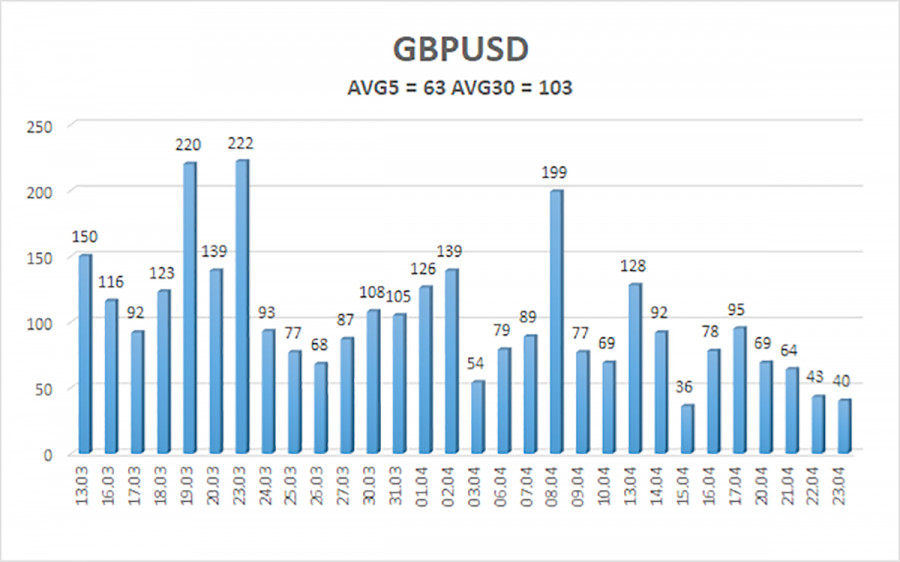
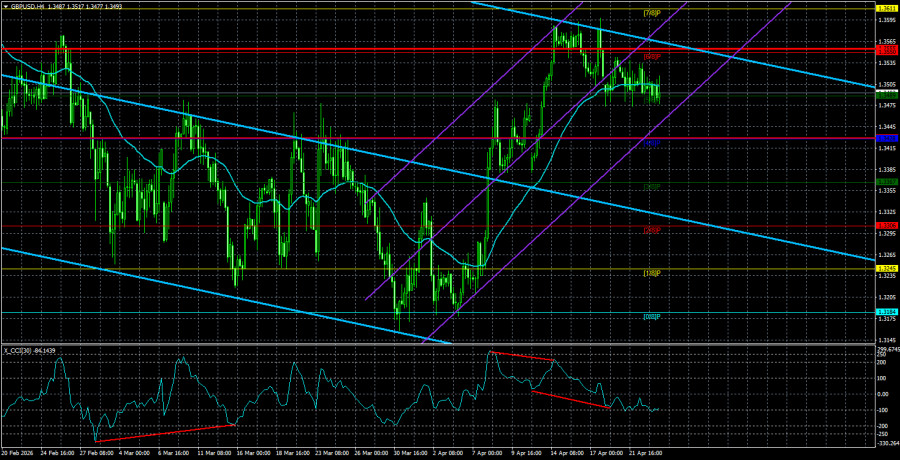
The average volatility of the GBP/USD pair over the last five trading days is 63 pips, which is considered "average" for this pair. On Friday, April 24, we expect movements within a range bounded by 1.3429 and 1.3555. The upper channel of the linear regression is directed downward, indicating a bearish trend. The CCI indicator has entered overbought territory and formed a "bearish" divergence, signaling a downward pullback.
The GBP/USD pair continues to recover after two "months of geopolitics." Trump's policies will continue to exert pressure on the U.S. economy, so we do not expect the U.S. dollar to grow in 2026. Thus, long positions with a target of 1.3916 and above remain relevant as long as the price is above the moving average. If the price is below the moving average line, short positions can be considered with targets of 1.3428 and 1.3367 on technical grounds. In recent weeks, the British currency has recovered, while the geopolitical factor has lost its influence on the market.
Linear regression channels help to define the current trend. If both are directed in the same way, it means the trend is currently strong;
The moving average line (settings 20,0, smoothed) determines the short-term trend and the direction in which trading should currently be conducted;
Murray levels are target levels for movements and corrections;
Volatility levels (red lines) indicate the probable price channel in which the pair will operate over the next day, based on current volatility readings;
The CCI indicator – its entrance into the oversold area (below -250) or the overbought area (above +250) indicates that a trend reversal in the opposite direction may be approaching.

QUICK LINKS
ForexMart is authorized and regulated in various jurisdictions.
(Reg No.23071, IBC 2015) with a registered office at First Floor, SVG Teachers Co-operative Credit Union Limited Uptown Building, Corner of James and Middle Street, Kingstown, Saint Vincent and the Grenadines
Restricted Regions: the United States of America, North Korea, Sudan, Syria and some other regions.


 Contact Us

