Citi potvrdila svůj optimistický pohled na akcie Eli Lilly (NYSE:LLY), protože vnímá výrazný potenciál růstu díky orforglipronu – jednou denně užívanému perorálnímu léku proti obezitě.
Banka předpovídá tržby přesahující 40 miliard USD po roce 2030, což je výrazně více než aktuální konsenzus ve výši 25 miliard USD. Tento růst má být tažen „dynamickým trhem zaměřeným na spotřebitele“.
Orforglipron by měl být uveden na trh v roce 2026 v době, kdy se oblast léčby obezity přesouvá z injekčních forem na tablety.
Citi tvrdí, že platforma LillyDirect – digitální lékárenská služba společnosti – bude hrát klíčovou roli v rozšiřování dostupnosti, zejména mezi pacienty s nižším až středním BMI.
Analytici odhadují potenciální příležitost v oblasti spotřebitelské platformy na 15 miliard USD, což podle nich zatím není započítáno do jejich modelu.
„Ať už se to nakonec naplní či ne, zůstáváme pozitivní vůči Lilly/orforglipronu,“ uvedl analytický tým Citi pod vedením Geoffa Meachama.
Banka ponechává doporučení „Buy“ a cílovou cenu 1 190 USD za akcii Eli Lilly.
Data o předpisech navíc podporují sílu platformy. Od spuštění LillyDirect a distribuce léku Zepbound v srpnu loňského roku vzrostl počet předpisů přes platformu o 178 % mezičtvrtletně, zatímco celkový růst předpisů Zepbound činil jen 19 %.
Podle analytiků to naznačuje, že platforma dosáhla skutečného rozsahu.
Vidí také výhodu v cenové strategii založené na příjmových kategoriích – ceny mezi 50 až 300 USD, s největším tržním potenciálem ve skupině s příjmem mezi 100 000 a 250 000 USD a BMI 25–30.
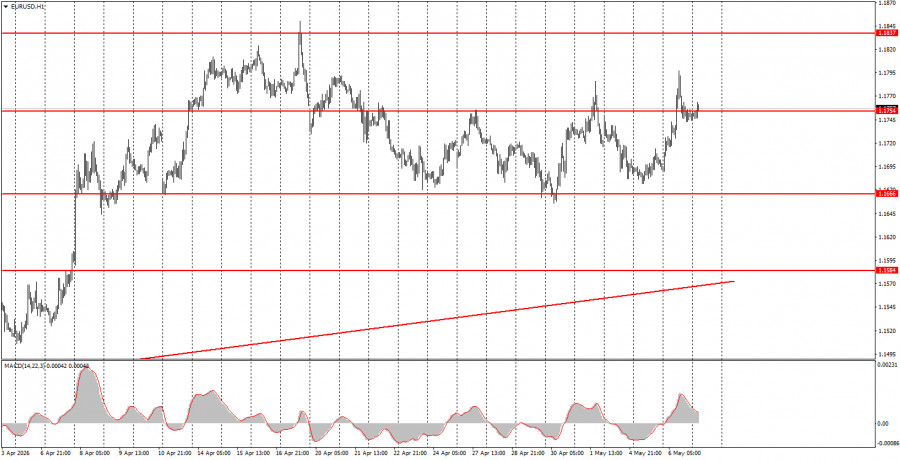
The EUR/USD currency pair attempted to resume its upward trend on Wednesday, but once again failed. Over the past two weeks, the European currency has been rising, but the illustration above clearly shows how weak that rise has been. The upward trend is minimal. However, the dollar is not growing either, as positive signals continue to emerge from the Middle East, albeit unconfirmed. For instance, it became known yesterday that Iran is generally ready for a deal with the US, but "on fair terms." Donald Trump also stated that a "framework agreement" with Tehran may be signed soon, which would help avoid a resumption of conflict and allow negotiations to continue. Thus, we do not know how close the parties are to reaching at least a framework agreement, or whether they are willing to compromise to resolve the most contentious issues. Yet, positive signals keep coming in. The macroeconomic environment was once again ignored by traders.
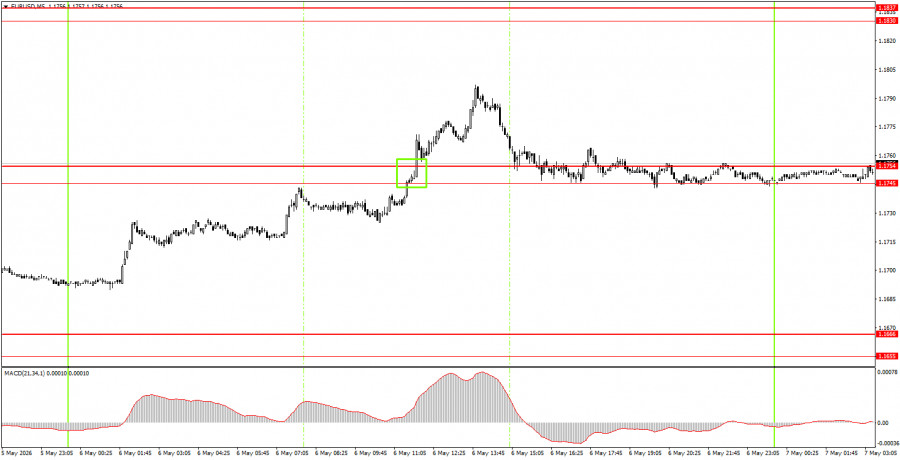
On the 5-minute timeframe on Wednesday, only one buy signal was formed. During the European trading session, the pair surpassed the 1.1745-1.1754 area, but the rally in the European currency proved short-lived. Just a few hours later, the quotes returned to the 1.1745-1.1754 range, where they remained until the end of the day.
On the hourly timeframe, the upward trend remains, but the euro has been trading in a range for two weeks. The geopolitical situation is not improving and may worsen at any time. The world does not expect a real truce between Iran and America and is learning to live without oil from the Middle East. Therefore, it is no longer reasonable to expect a significant strengthening of the dollar. At most, the correction we have been observing for almost a month will continue.
On Thursday, beginner traders can open short positions with a target of 1.1655-1.1666 if the price consolidates below the 1.1745-1.1754 range. New buy positions can be considered if the price consolidates above the 1.1745-1.1754 area, with a target of 1.1830-1.1837.
On the 5-minute timeframe, the following levels should be considered: 1.1354-1.1363, 1.1413, 1.1455-1.1474, 1.1527-1.1531, 1.1584-1.1591, 1.1655-1.1666, 1.1745-1.1754, 1.1830-1.1837, 1.1899-1.1908. On Thursday, a retail sales report will be published in the Eurozone, while in the US, jobless claims figures will be released. Under the current circumstances, the likelihood of the market reacting to this data is minimal.
Price levels (areas) of support and resistance – levels that are targets when opening purchases or sales, or sources of signals.
Red lines – channels or trend lines that display the current trend and indicate which direction is preferable to trade now.
MACD indicator (14, 22, 3) – histogram and signal line – a supporting indicator that can also be used as a source of signals.
Important speeches and reports (contained in the news calendar) can significantly influence the movement of the currency pair. Therefore, during their release, trading should be done as cautiously as possible, or one should exit the market to avoid a sharp price reversal against the preceding movement.
Beginners trading in the Forex market should remember that not every trade can be profitable. Developing a clear strategy and effective money management are key to long-term trading success.

QUICK LINKS
ForexMart is authorized and regulated in various jurisdictions.
(Reg No.23071, IBC 2015) with a registered office at First Floor, SVG Teachers Co-operative Credit Union Limited Uptown Building, Corner of James and Middle Street, Kingstown, Saint Vincent and the Grenadines
Restricted Regions: the United States of America, North Korea, Sudan, Syria and some other regions.


 Contact Us

