Latinskoamerické akcie vykázaly od začátku roku silný výkon, přičemž celkové výnosy v amerických dolarech přesáhly 30 % ve většině zemí regionu, jak uvádí nejnovější zpráva Bank of America (NYSE:BAC). V uplynulém měsíci však byly výnosy v Latinské Americe převážně stabilní v důsledku volatility související s novinkami v oblasti cel.
Zahraniční příliv do Brazílie se minulý měsíc zpomalil, přičemž příliv do hotovostních akcií byl kompenzován odlivem z futures. Podle údajů B3/Neoway/Datawise+ byli cizinci v červnu čistými kupci s čistým přílivem 4,6 miliardy R$ do hotovostních akcií, přičemž nakupovali především v sektorech energetiky, surovin a veřejných služeb. Místní fondy byly čistými prodejci ve většině sektorů.
Zpráva ukazuje, že zatímco zahraniční investoři od poloviny dubna zvyšují své expozice v Brazílii, místní fondy zůstávají od začátku roku prodávajícími. Celkové zahraniční toky do B3 byly v červnu utlumené, přičemž příliv 5 miliard R$ prostřednictvím hotovostních akcií byl zcela kompenzován odlivem 5 miliard R$ z futures. Zahraniční příliv (hotovostní akcie a futures) od začátku roku dosáhl 27 miliard R$.
Odliv z brazilských lokálních akciových fondů ve druhém čtvrtletí 2025 zpomalil na průměrných 1,2 miliardy R$ týdně, ve srovnání s průměrným odlivem 2 miliardy R$ týdně v prvním čtvrtletí. Alokace do akcií v rámci lokálního fondového průmyslu poklesla v květnu na 7,7 % oproti 7,8 % v dubnu, přičemž poslední vrchol byl zaznamenán v prosinci 2023 na úrovni 9,5 %.
Globální fondy zaměřené na Latinskou Ameriku zaznamenaly od začátku roku příliv 2,9 miliardy USD, což je výrazné zlepšení oproti loňským odlivům ve výši 7 miliard USD. Příliv do rozvíjejících se trhů s výjimkou Číny se v posledních čtyřech týdnech zrychlil a přidal 12 miliard USD, čímž od začátku roku dosáhl 2,9 miliardy USD.
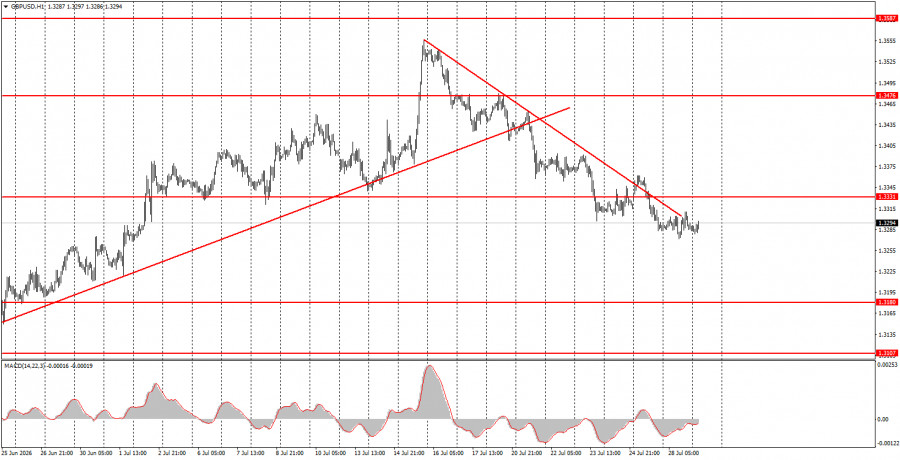
The GBP/USD pair remained in a downward trend on Tuesday, but a day earlier, the descending trendline was broken, so we are anticipating the end of the trend. Of course, making such bold statements before the meetings of two central banks is not entirely correct, but at the same time, both central banks do not intend to change monetary policy parameters in July. The market will certainly react to any outcomes from the Federal Reserve and Bank of England meetings. However, anticipating the market's reaction is impossible. Let's remember that central banks are currently basing their actions on inflation. In the UK, inflation is declining, so expecting any hawkish measures from the BoE makes little sense. In the US, inflation is also decreasing, but it remains significantly higher than in the UK. Its prospects depend on oil prices, which are influenced by geopolitical factors and the Strait of Hormuz. Their future is uncertain. Therefore, the Fed will undoubtedly refrain from announcing any tightening of policy today, and how the market interprets Warsh's statements remains a mystery. We can expect any market movement today.
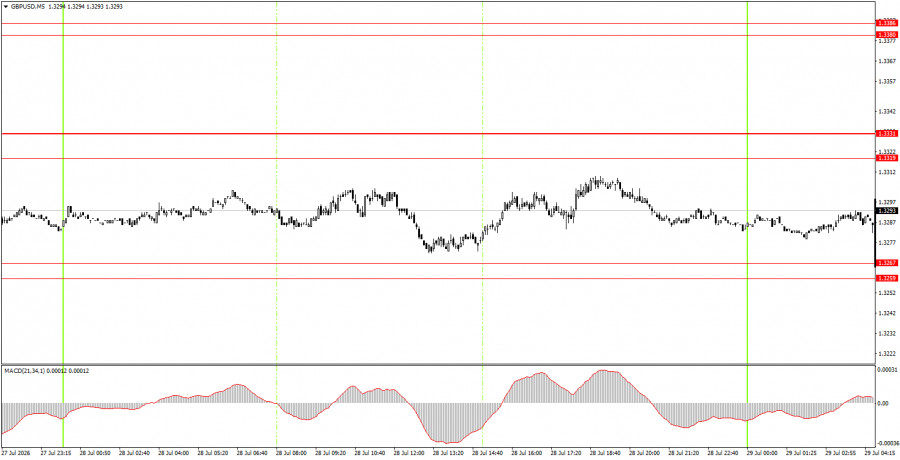
On the 5-minute timeframe, no trading signals were formed on Tuesday. Throughout the day, the British pound failed to respond to the areas 1.3259-1.3267 or 1.3319-1.3331. Therefore, there were no grounds for opening trades for novice traders.
On the hourly timeframe, the GBP/USD pair may begin a new upward trend. After three weeks of growth, a correction was necessary, but it may be nearing completion since the trendline has been broken. Technically, any rise in the British currency in the coming days and weeks will be completely justified.
On Wednesday, novice traders may open short positions if the price settles below the area of 1.3259-1.3267 with a target of 1.3175-1.3180. Long positions can be considered on a bounce from the area of 1.3259-1.3267 or if the price settles above the area of 1.3319-1.3331.
On the 5-minute timeframe, levels to consider include 1.3096-1.3107, 1.3175-1.3180, 1.3259-1.3267, 1.3319-1.3331, 1.3380-1.3386, 1.3456-1.3476, 1.3587-1.3598, 1.3631-1.3641, and 1.3695. On Wednesday, there are no significant events or publications scheduled in the UK, but in the US, the results of the Fed meeting will be announced in the evening, which will surely provoke volatility in the market. Thus, all attention is on the Fed and Kevin Waller's speech.
Price levels (areas) of support and resistance are targets when opening long or short positions or sources of signals.
Red lines indicate channels or trend lines that display the current trend and indicate the preferred direction for trading.
The MACD indicator (14,22,3) – histogram and signal line – is a supplementary indicator that can also be used as a source of signals.
Important speeches and reports (contained in the news calendar) can significantly impact the movement of the currency pair. Therefore, during their release, trading should be conducted with maximum caution, or one should exit the market to avoid sharp reversals against preceding movements.
Beginners trading in the forex market should remember that not every trade can be profitable. Developing a clear strategy and practicing money management are key to long-term success in trading.

QUICK LINKS
ForexMart is authorized and regulated in various jurisdictions.
(Reg No.23071, IBC 2015) with a registered office at First Floor, SVG Teachers Co-operative Credit Union Limited Uptown Building, Corner of James and Middle Street, Kingstown, Saint Vincent and the Grenadines
Restricted Regions: the United States of America, North Korea, Sudan, Syria and some other regions.










 Contact Us