Společnost Nvidia (NASDAQ:NVDA) vedla v pondělí pokles akcií „sedmičky velkolepých“, což znamenalo ochlazení technologické rallye, díky níž index Nasdaq 100 rostl čtyři dny po sobě. Zpomalení je přičítáno nejistotě kolem obchodní politiky a budoucího směřování ekonomiky.
Akcie společnosti Nvidia klesly o 1,5 %, což je nejvýraznější pokles mezi „velkolepou sedmičkou“, do které patří také Amazon (NASDAQ:AMZN), Microsoft (NASDAQ:MSFT), Apple (NASDAQ:AAPL), Alphabet (NASDAQ:GOOGL), Meta (NASDAQ:META) a Tesla (NASDAQ:TSLA). Akcie Amazonu klesly o 1,4 %, Microsoftu o 0,9 %, Applu i Alphabetu o 0,8 %, Meta o 0,7 % a Tesla o 0,5 %.
Futures na Nasdaq 100 rovněž klesly o 0,9 % po růstu o 3,5 % v předchozích čtyřech seancích. To naznačuje pauzu v technologické rally, která po několik dní vytrvale postupovala vpřed.
Kromě technologických akcií čelí výraznému tlaku také akcie společností s mediální expozicí. Ten následuje po oznámení prezidenta Trumpa o plánu zavést 100% clo na filmy vyrobené v zahraničí. Očekává se, že tento krok bude mít dopad na ziskovost těchto společností, což povede k poklesu cen jejich akcií.
On Thursday, GBP/USD also traded lower, although the British pound had absolutely no grounds for decline. One might assume that the euro pulled the pound down with it, but even the euro's fall raises questions—particularly since it started two hours after the weak unemployment report was published.
The technical picture on the hourly timeframe remains unchanged. Despite Wednesday's and Thursday's declines, the new uptrend is still valid, though it remains very weak and uncertain as long as the Senkou Span B line is not broken. Friday may not provide clarity either and could create even more confusion. For starters, it is still unclear whether U.S. labor market and unemployment data will be released. Many experts argue they won't, since the U.S. Bureau of Labor Statistics has been shut down. At the same time, doubts remain that the reports might still be published.
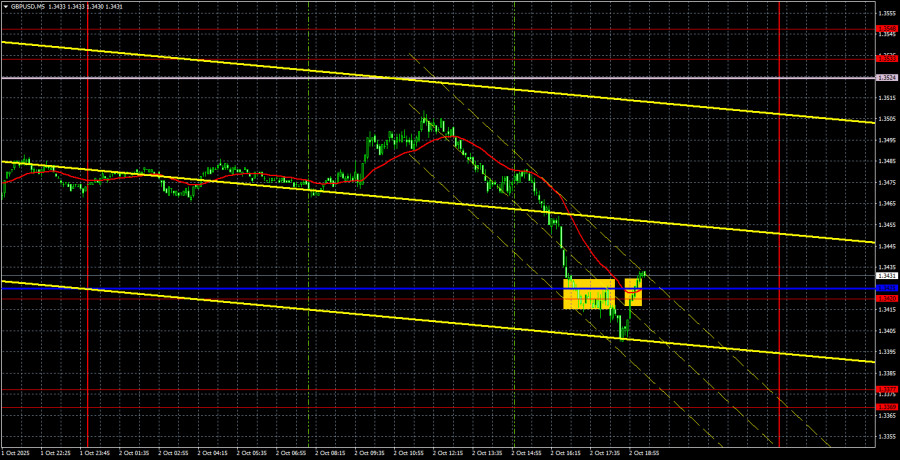
On the 5-minute chart, the first sell signal appeared when the downward movement was already ending. The price broke through the Kijun-sen line and the 1.3420 level, but within half an hour it returned above them. At this point, the breakout of the critical line can be considered false.
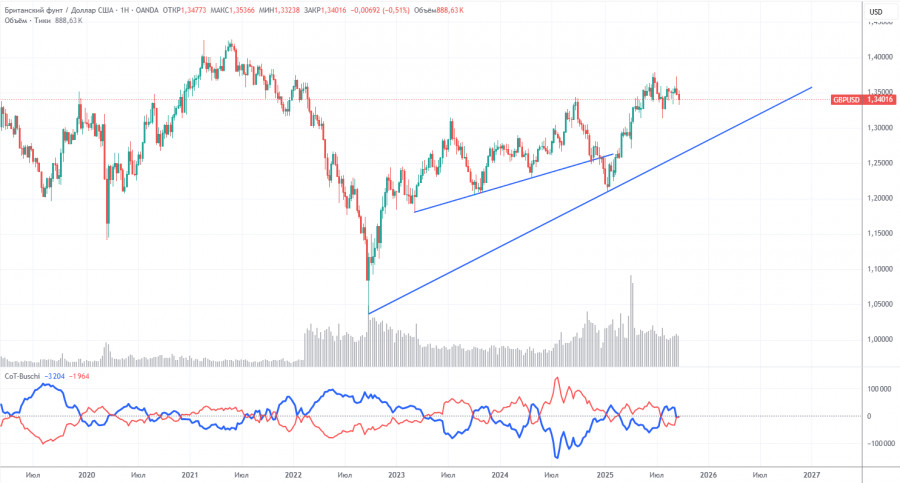
COT reports on the British pound indicate that, in recent years, the sentiment of commercial traders has shifted constantly. The red and blue lines, reflecting the net positions of commercial and non-commercial traders, intersect frequently and usually hover near the zero mark. Currently, they are almost at the same level, indicating a roughly equal number of long and short positions.
The dollar continues to weaken due to Donald Trump's policies, so demand from market makers for the pound is not particularly significant at this time. The trade war is likely to persist in some form for an extended period. The Fed will have to cut rates within the next year. Dollar demand will decline regardless.
According to the latest report on the pound, the "Non-commercial" group opened 3,700 new long contracts and closed 900 short contracts. Thus, the net position of non-commercial traders increased by 4,600 contracts in a week.
In 2025, the pound rose significantly, and the reason is clear: Donald Trump's policies. Once that factor is neutralized, the dollar could resume growth. But no one knows when that will happen. It doesn't matter how quickly the net position of the pound rises or falls. On the dollar, it's falling anyway—and usually at a faster pace.
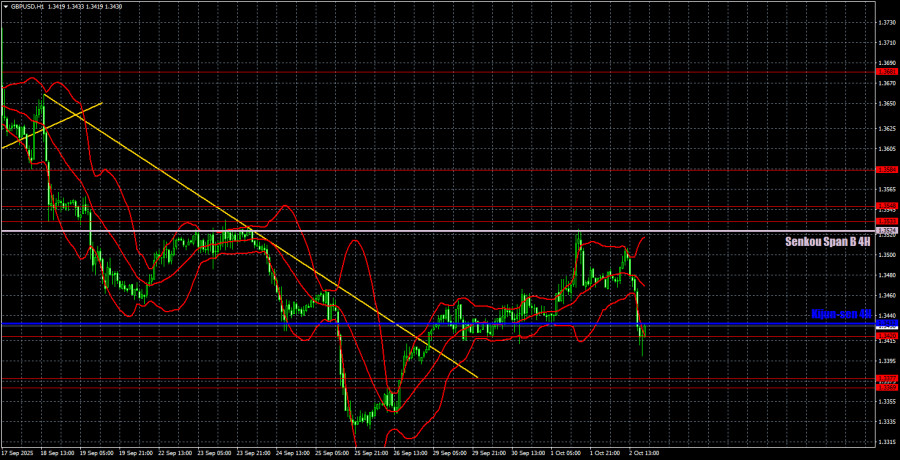
On the hourly chart, GBP/USD maintains a new uptrend. The trendline has been broken, giving traders reason to expect further growth. The dollar still lacks global drivers for strength, so we expect the 2025 uptrend to resume in almost any scenario. This week, the pair rebounded from the important Senkou Span B line, which triggered a correction. However, the price did not drop below the critical line.
For October 3, the following key levels are highlighted: 1.3125, 1.3212, 1.3369–1.3377, 1.3420, 1.3533–1.3548, 1.3584, 1.3681, 1.3763, 1.3833, 1.3886. Senkou Span B (1.3524) and Kijun-sen (1.3432) can also generate signals. The stop loss should be moved to breakeven once the price moves 20 pips in the desired direction. The Ichimoku indicator lines may shift during the day, which must be considered when identifying signals.
No important events are scheduled in the UK on Friday. In the U.S., however, three key releases are on the calendar: the Non-Farm Payrolls report, the unemployment rate, and the ISM Services Index. It is still unclear whether the first two will actually be published.
Today, traders can expect growth to resume. The Kijun-sen line was falsely broken, and Thursday's decline in the pound was not justified. However, the outlook depends entirely on U.S. macroeconomic data—and on whether it is released at all.

QUICK LINKS
ForexMart is authorized and regulated in various jurisdictions.
(Reg No.23071, IBC 2015) with a registered office at First Floor, SVG Teachers Co-operative Credit Union Limited Uptown Building, Corner of James and Middle Street, Kingstown, Saint Vincent and the Grenadines
Restricted Regions: the United States of America, North Korea, Sudan, Syria and some other regions.


 Contact Us

